Google DeepMind's new 10 m forest-type map, read for every Philippine province, with a first look at eight years of change. Tree crops now cover more land than primary forest; an early-release series shows natural forest still being opened up, most of all in Palawan and fastest in Maguindanao; and one of the hardest lines to draw from orbit is the one between regrowth and coconut.
Wovoka Advisory · 23 October 2026
27.6%of Philippine land is tree crops and agroforestry, more than primary forest (15.5%), in the 2020 map
107,000 haBeta dataof natural forest converted between 2017 and 2025, 0.9% of the total; 26,300 ha grew back
PalawanBeta datalost the most: 13,000 ha. Maguindanao lost the largest share of its forest, 5.1%
7 of 57validation sites the map calls tree crops, where both expert reviewers agreed, were regrowing forest; 3 are in Western Samar
A tree-cover map answers one question: are there trees? Carbon accounting, restoration eligibility and the EU Deforestation Regulation (EUDR) ask a different one: what kind of trees, and how did they get there. On 21 October 2026 a team from Google DeepMind, Google Research, the World Resources Institute and IIASA published a global map that answers it at 10 m resolution (Neumann et al., Scientific Data 13, 1434). Google announced it the next day. By the following morning in Manila it was a layer in Wovoka Maps, the internal project map tool built by our sister company Wovoka, and we had read it for the whole country.
The map is called Forest Typology, or ForTy. It sorts every 10 m pixel of land into six classes that follow FAO and EUDR definitions, and it is open under CC BY 4.0.
Primary forestNative forest with no clearly visible sign of human activity.15.5% of land in 2020
Naturally regeneratingForest established by natural regeneration, including regrowth after logging or clearing.23.5% of land in 2020
Planted forestForest established by planting or seeding, with a rotation longer than 40 years.0% of land in 2020
Plantation forestIntensively managed, even-aged stands of one or two species, rotation of 40 years or less.0.4% of land in 2020
Tree crops & agroforestryCoconut, oil palm, rubber, fruit, shaded coffee and cacao. Farmland under EUDR.27.6% of land in 2020
Other landEverything else: cropland, grassland, settlements, bare ground, sparse trees.33.1% of land in 2020
The country in 2020
We counted the 2020 map tile by tile inside 87 province-level boundaries: 81 provinces (in boundaries from before Maguindanao was split in 2022), Metro Manila's four districts, and Isabela City and Cotabato City, which the boundary file maps apart from their provinces. Where neighbouring tiles overlap, each pixel is counted once. Together the 87 units hold 294,165 km² of mapped area, which matches the area inside their boundaries to within 0.1%. ForTy has no water class. Where it maps lakes such as Lake Lanao and Taal Lake, rivers, fishponds and the strips of sea that the simplified province outlines take in along the coast, it calls almost all of them (98% of the water pixels it maps) other land. We leave out about 1,970 km² of mapped pixels that fall on the water mask of Hansen et al.'s Global Forest Change data (University of Maryland), which leaves 292,194 km² of land, 2.0% less than the 298,170 km² of land in the CIA World Factbook's last edition (it gives the country the usual 300,000 km² in all, 1,830 km² of it water). On the maps, lakes therefore appear as other land, or blank where ForTy has no data, as in parts of Lake Lanao; only the 10 m windows mark water.
Primary
Naturally regenerating
Plantation
Tree crops & agroforestry
Other land
Share of land by class, 2020, counted pixel by pixel at 10 m. Planted forest does not appear in the Philippine map.
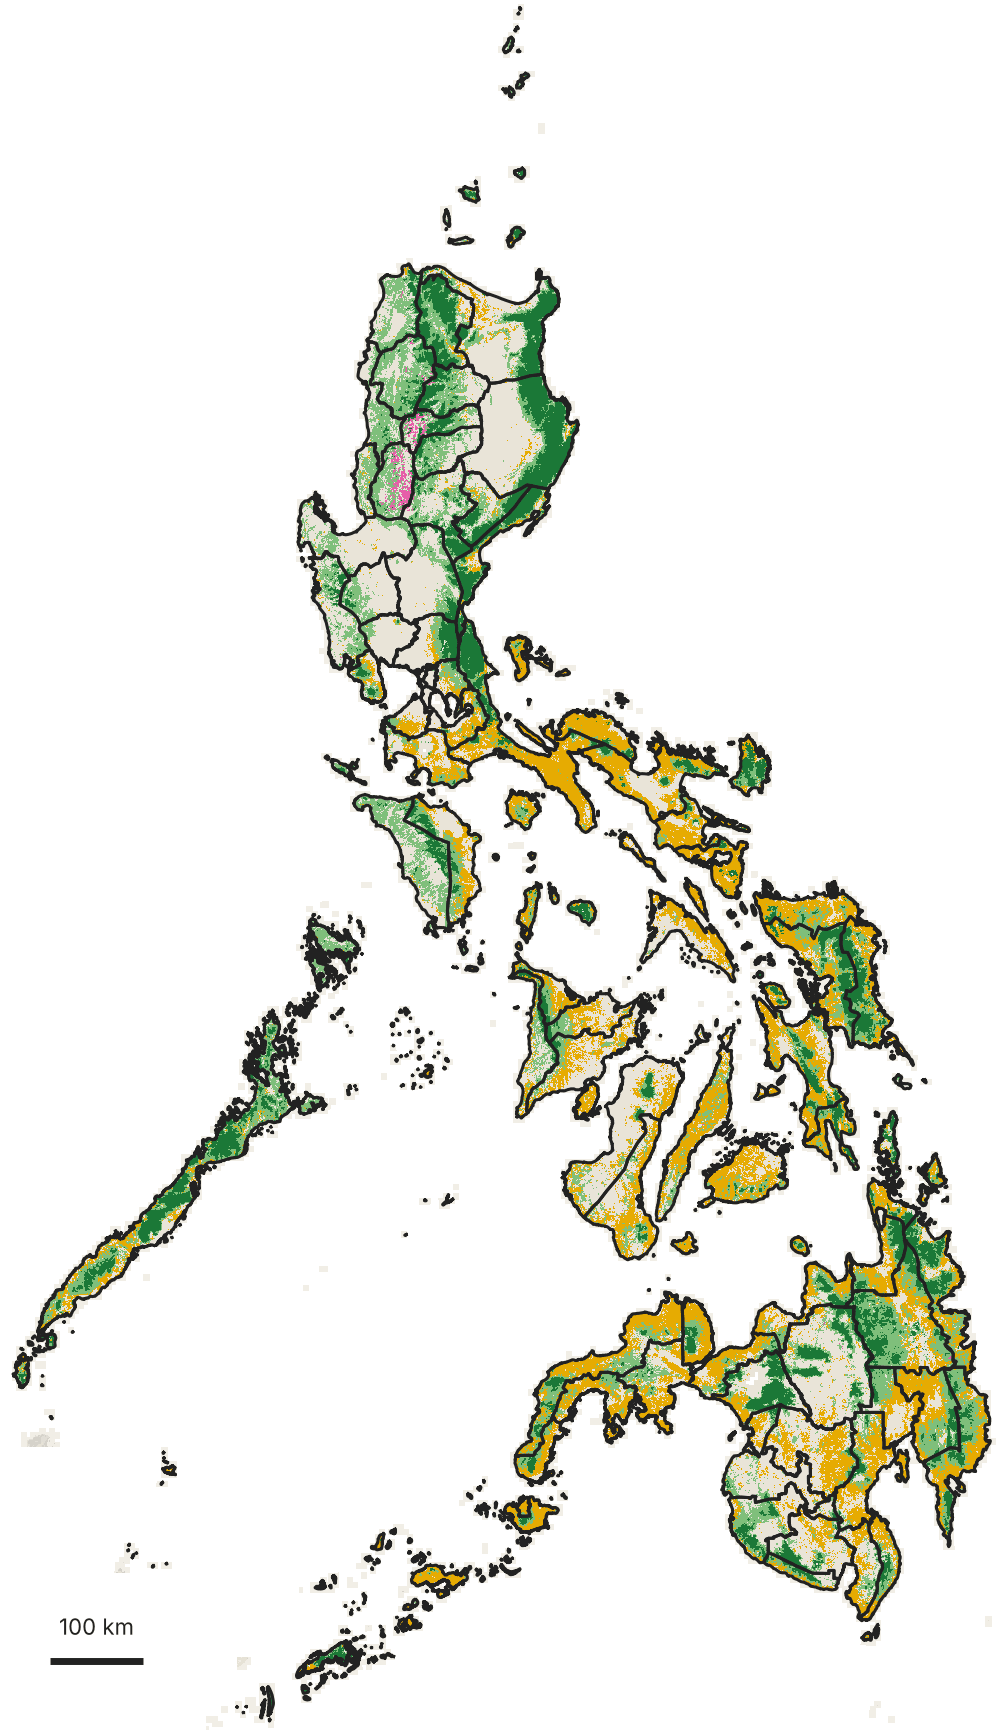
Natural forest covers 39.0% of the land: 15.5% primary and 23.5% regrowing. Tree crops and agroforestry cover 27.6%, about 8.1 million hectares, more than the 4.5 million hectares of primary forest. Plantation forest is 0.4%, 79% of it in Benguet and Mountain Province (more on that below), and the long-rotation planted forest class does not appear anywhere in the Philippine map.
ForTy's 11.4 million hectares of natural forest is well above the roughly 7.2 million hectares of forest cover in the 2020 land cover map that NAMRIA produced and DENR reports. Both start from the FAO definition of forest, which DENR adopted in 2005, so the gap most likely comes from how each map applies it: different inputs, methods and years, and probably more young regrowth counted as forest in ForTy, whose naturally regenerating class includes regrowth only a few years old. The gap is a reason to put the maps side by side before either number goes into a document.
Primary forest
Naturally regenerating forest
Plantation forest
Tree crops & agroforestry
Other land
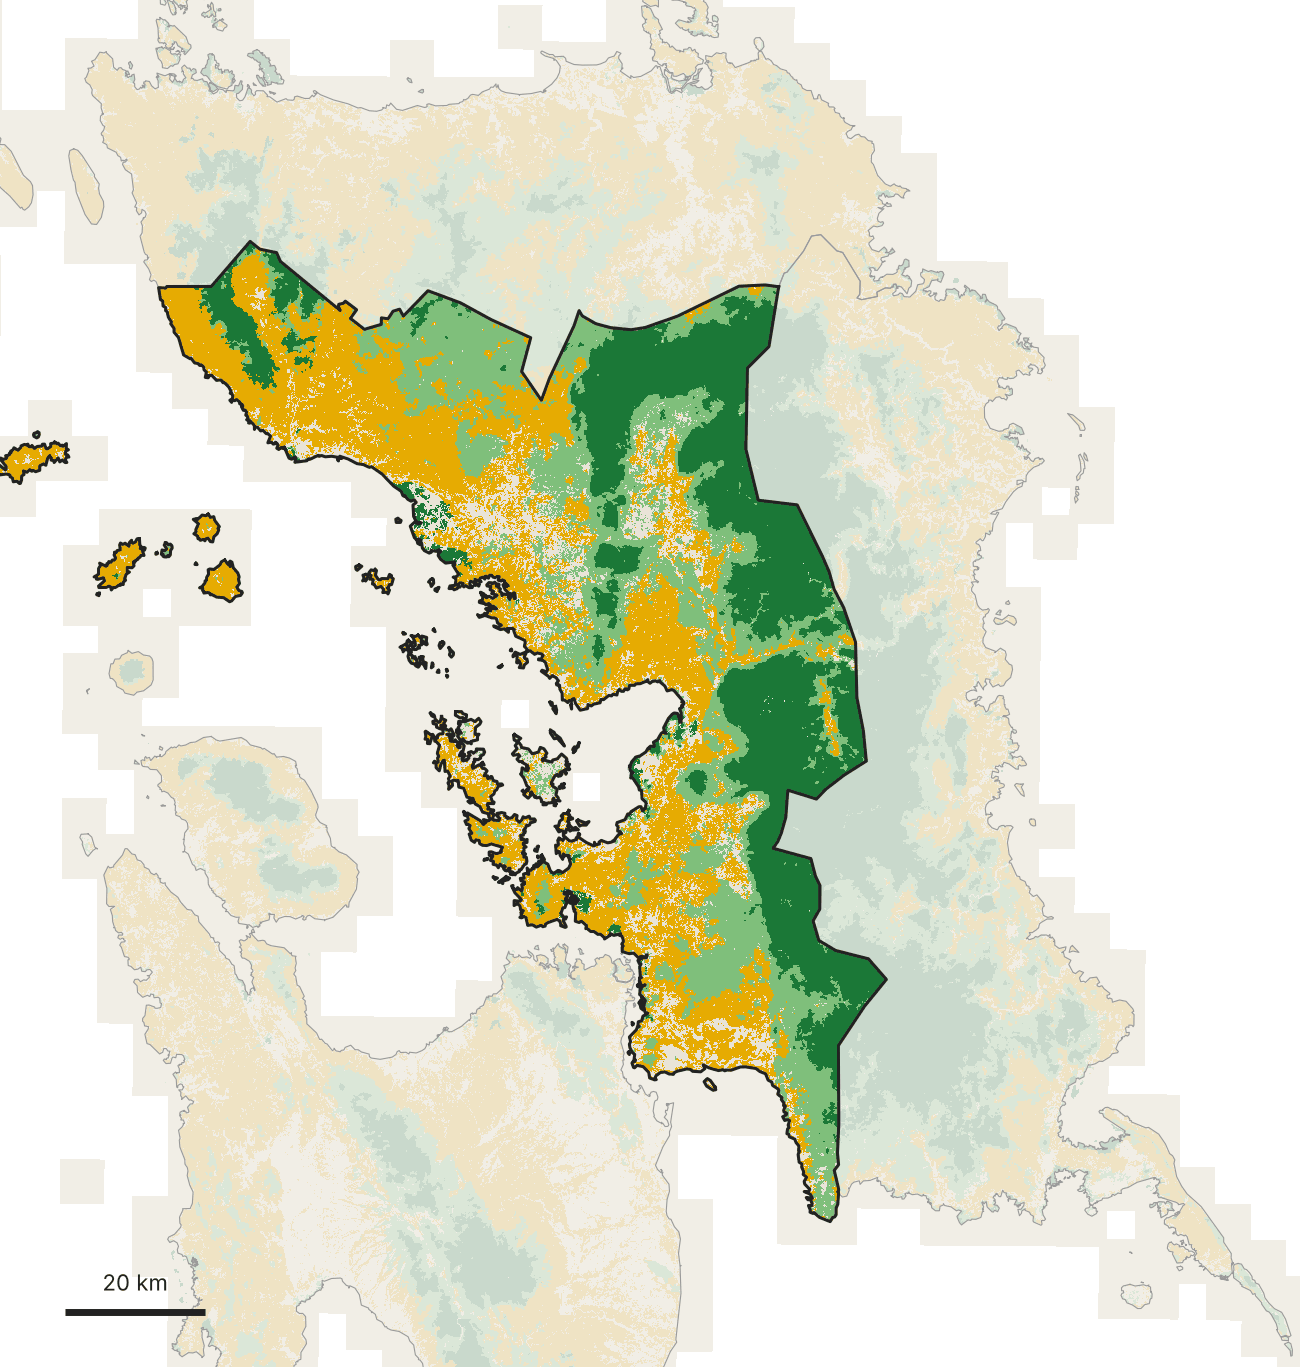
ForTy 2020, the most common class in cells of about 650 m, shown at about 1 km per pixel, provinces outlined. Neumann et al. 2026, CC BY 4.0. Boundaries: geoBoundaries (NAMRIA, PSA, OCHA).
Ranked province by province, the country splits into forest provinces and tree-crop provinces, with the four landscapes discussed below on both sides. Eastern Samar has the 7th-highest share of primary forest of the 81 provinces (36.2%, level with Quirino in 6th); Zamboanga Sibugay is 19th for tree crops.
All 81 provinces, ranked by natural forest share. The provinces of the four landscapes discussed below are coloured and labelled.The same provinces ranked by tree crops and agroforestry.
Eight years of change Beta data
Alongside the 2020 map, Google released an annual series for 2017 to 2025. Google says it applies a similar approach to each year, and it is marked as an early release. Google's announcement says it is available under an open licence, but no licence terms or accuracy assessment have been published for it yet. We read it as a first look at change, not a measurement, and every chart and map drawn from it below carries a beta label. To keep year-to-year flicker out of the count, a pixel counts as changed only when the map agrees with itself two years running at each end: natural forest in both 2017 and 2018 and something else in both 2024 and 2025, or the reverse.
Beta dataChange in national area since 2017, in thousand hectares, for each year of Google's 2017–2025 early-release series. Plantation forest (about 108,000 ha) barely moves and is left out.
On that test, 107,000 hectares of natural forest became something else between 2017 and 2025, 0.9% of the 11.6 million hectares the series maps in 2017. 26,300 hectares went the other way, nearly all of it open land growing back into forest. For every hectare that came back, about 4 were lost.
Beta dataLand that held one class in both 2017 and 2018 and another in both 2024 and 2025, nationally. Natural forest that changed is grouped by its 2025 class. Band widths are to scale. Smaller flows, about 4,100 ha in all, are left out: mostly between plantation forest and other land, plus about 400 ha that grew back into natural forest from tree crops, plantation or mixed classes.
Most of the forest that went became open land (93%), not tree crops (7%). Tree crops themselves churned: 102,000 hectares of tree crops became open land, and 79,100 hectares of open land became tree crops. Some of that is real clearing and replanting. Some of it is one of the map's least certain boundaries, between tree crops and farmland, moving back and forth.
Which provinces lost the most
Beta dataThe 15 provinces with the most natural forest converted, 2017–2025, split by what it became. Blue bars to the left are natural forest that grew back over the same years. The percentage is the share of the province's 2017 natural forest that was converted. The provinces of the four landscapes discussed below are in green.
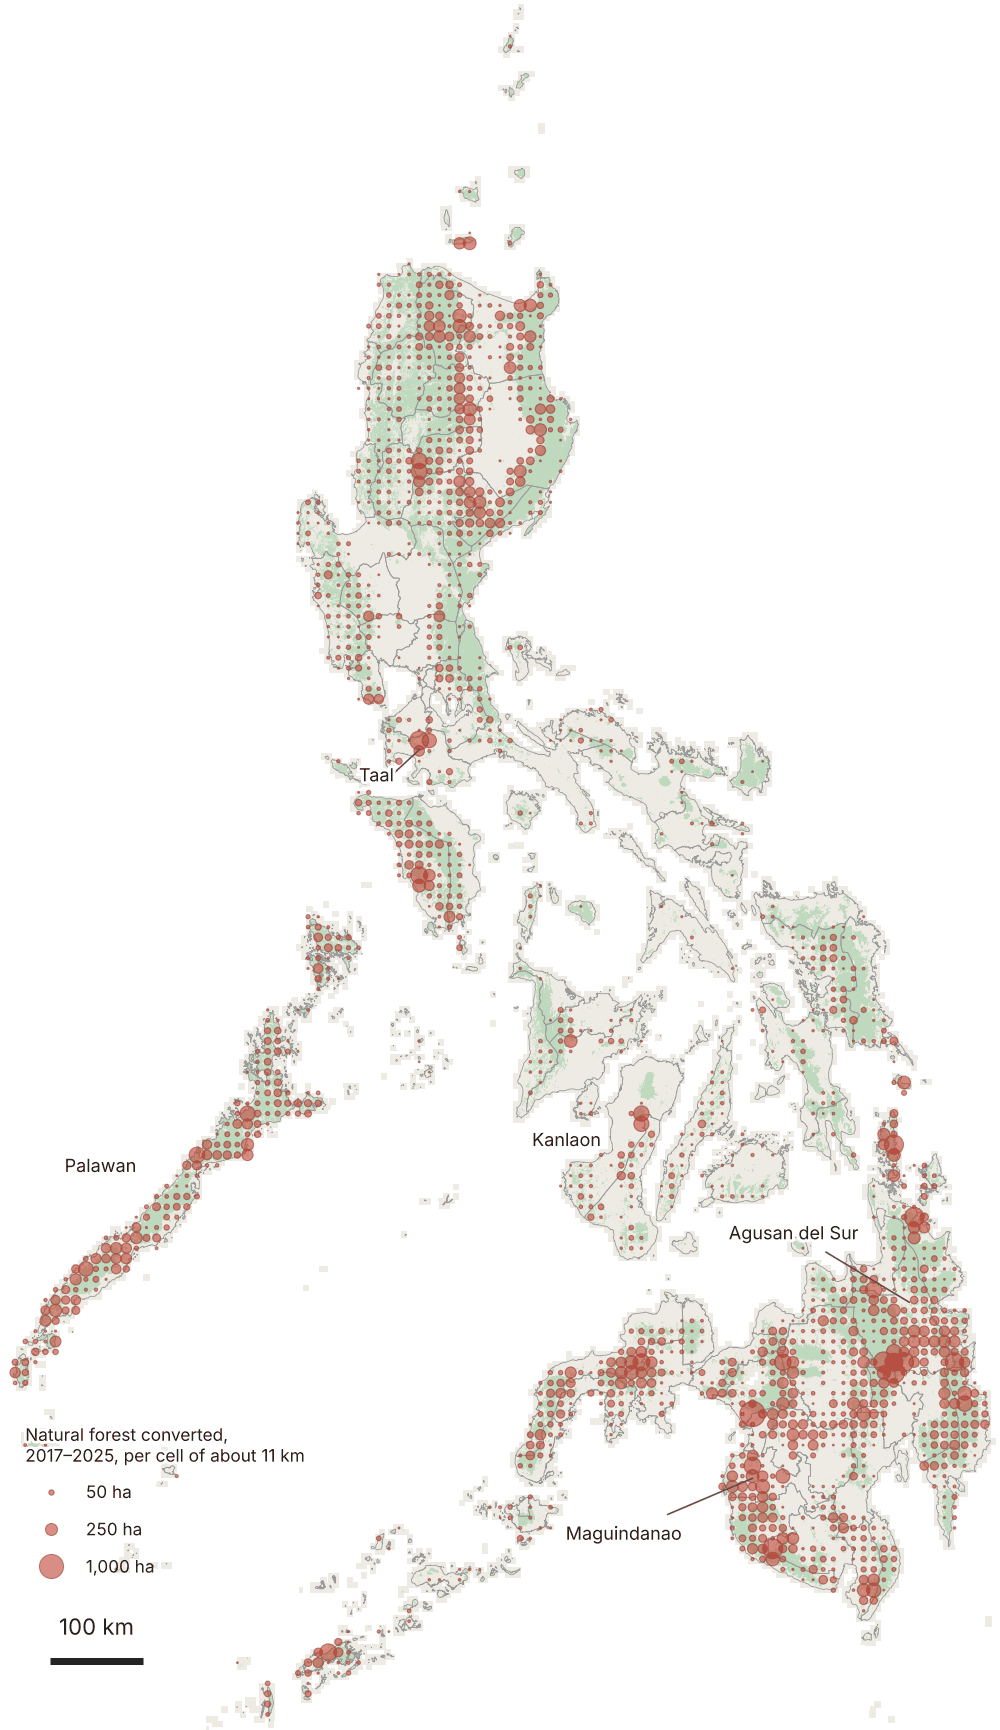
Palawan lost the most: 13,000 hectares of natural forest converted, 12% of the national total, against 4,260 hectares grown back. Agusan del Sur (7,670 ha), Maguindanao (4,490), Bukidnon (4,150) and Cagayan (3,760) follow. As a share of each province's forest, Maguindanao (split in 2022 into Maguindanao del Norte and Maguindanao del Sur) stands out: 5.1% of its natural forest converted in eight years, more than five times the national rate, followed by Dinagat Islands (3.9%) and Cotabato (3.8%).
Almost everywhere, the forest that went became other land. The largest areas of forest that became tree crops were in Palawan (1,220 ha), Agusan del Sur (507) and Davao Oriental (440), together about 30% of the national total. And regrowth rarely made up the difference: natural forest shrank on balance in 80 of the 81 provinces. Only Capiz ended the period with slightly more than it started with.
Primary forest
Naturally regenerating forest
Plantation forest
Tree crops & agroforestry
Other land
Natural forest converted, 2017–2025
Natural forest in 2024–25
Other land and tree crops
ForTy 2020, the most common class in cells of about 650 m, shown at about 1 km per pixel.Beta dataWhere natural forest was converted between 2017 and 2025, from Google's early-release annual series, summed in cells of about 11 km. Circle area is proportional to hectares converted.
Became other land
Became tree crops
Beta dataShare of each province's 2017 natural forest converted by 2025, the 12 highest among provinces with at least 20,000 ha of natural forest. Zamboanga del Sur includes Zamboanga City; without the city its share is 2.2%. In Batangas, about 75% of the forest converted is on Taal Volcano Island, most of it lost in 2020, the year of the January eruption (see the Taal slider below).
Primary forest is where a loss costs most, because it does not come back on any timescale that matters to a project. 21,700 hectares lost their primary status and settled into a new class, roughly half of it reading as regrowing forest in both 2024 and 2025 and half as something other than forest in both. Another 440 hectares switch between the two. Palawan accounts for 6,750 hectares, 31% of the national figure.
Became something other than forest
Now reads as regrowing forest
Beta dataPrimary forest in 2017 and 2018 that read as regrowing forest, or as something other than forest, in both 2024 and 2025: the ten provinces with the most.
Where tree crops moved
Tree crops moved most in central Mindanao. Cotabato gained 7,830 hectares of tree crops on land that was other land in 2017 and 2018, and Bukidnon 5,610. The same provinces also lost tree crops to open land, Bukidnon almost as much as it gained (4,960 hectares), which is what an active farm frontier looks like from orbit, and also one of the places where the map is least sure of itself.
Beta dataOpen land that became tree crops (right) and tree crops that became open land (left), 2017–2025: the 12 provinces with the most new tree crops.
Five places, year by year
At province scale, change is a fraction of a percent a year. Zoom to 10 m and it is unmistakable. Press play, or drag the slider.
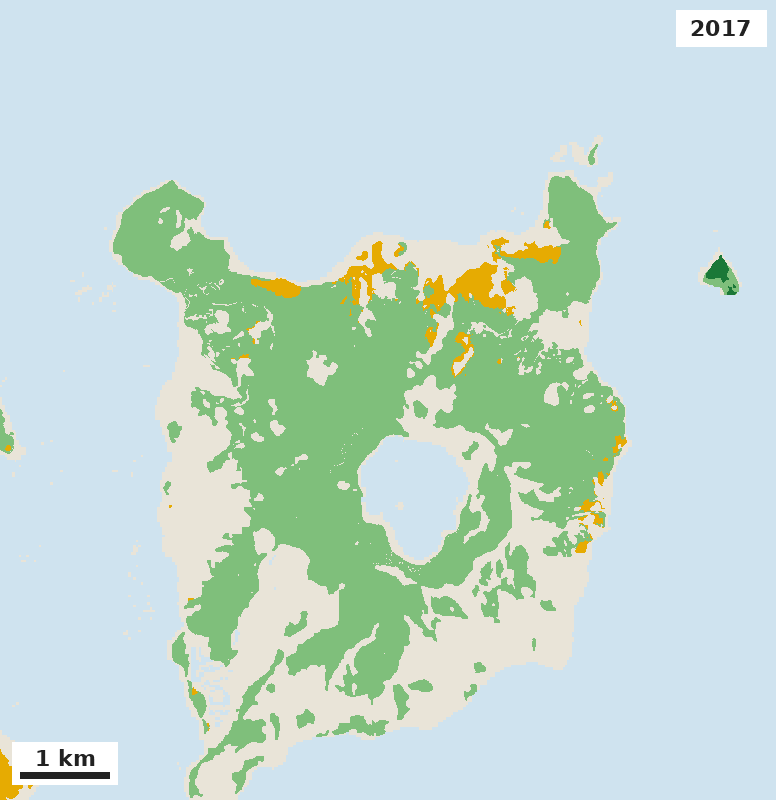
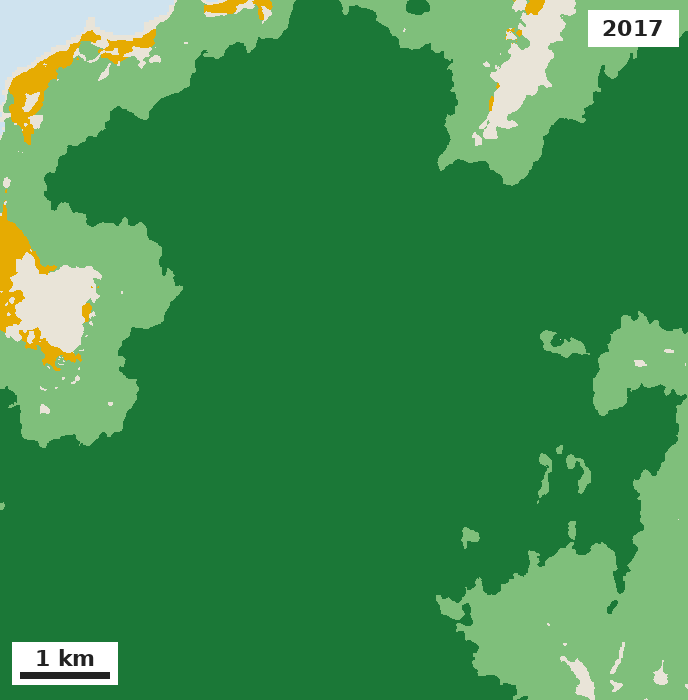
Not every loss is clearing. Slide a square about 5.5 km across over the whole country, and the two places where it takes in the most converted natural forest are both volcanoes: Taal Volcano Island (1,160 hectares) and Mount Kanlaon (766 hectares). Taal erupted in January 2020. In the window below, which takes in Volcano Island, natural forest falls from 1,402 hectares in 2018 to 230 in 2020, and almost none of it has come back by 2025. Most of the drop, 962 hectares, comes in 2020. The series puts the other 210 hectares in 2019, before the eruption, but a Sentinel-2 image from 24 December 2019, 19 days before the eruption, shows that ground as green as the forest that survived, and in March 2020, when the surviving forest was greening again, it was still bare. The early-release series dates part of the eruption's damage a year early.
Primary forest
Naturally regenerating forest
Tree crops & agroforestry
Other land
Water
Beta dataTaal Volcano Island and the lake around it, a window of about 9 by 9 km. Natural forest in the window: 1,402 ha in 2018, 1,192 ha in 2019, 230 ha in 2020 and 231 ha in 2025. Water from Hansen et al. Global Forest Change.
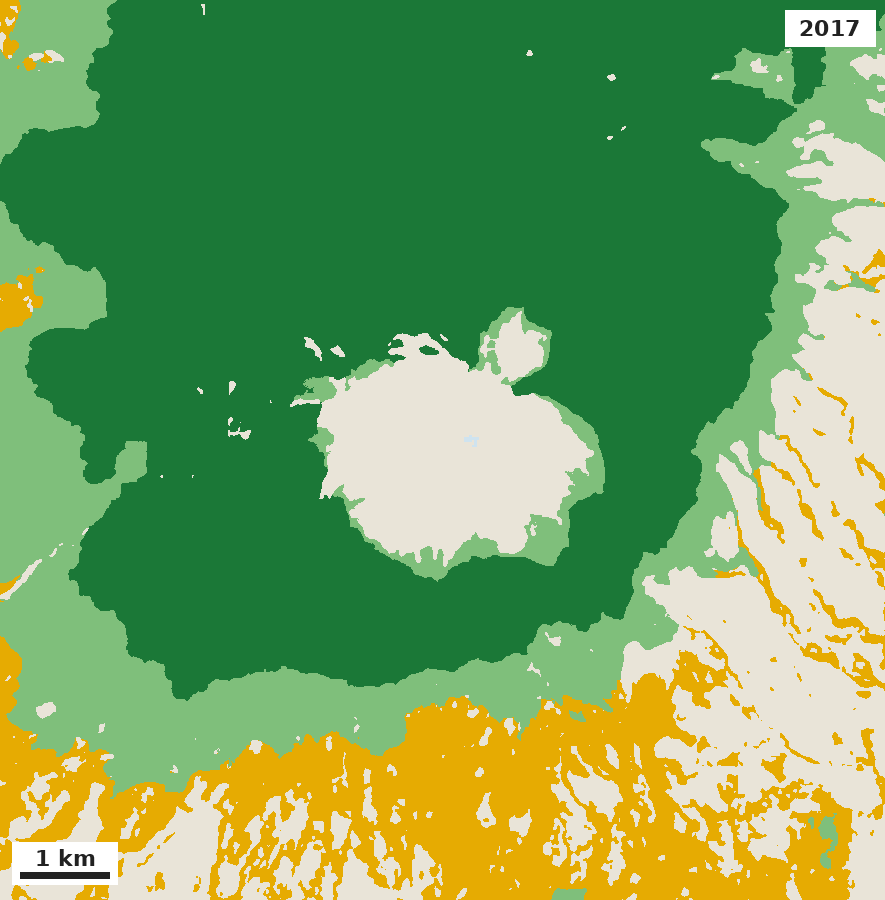
Mount Kanlaon on Negros erupted in June and December 2024. The forest on its upper slopes, most of it primary, holds steady until then. In 2024, 12% of it goes.
Primary forest
Naturally regenerating forest
Tree crops & agroforestry
Other land
Water
Beta dataThe summit and upper slopes of Mount Kanlaon, on the border of Negros Occidental and Negros Oriental, about 10 by 10 km. Natural forest: 6,320 ha in 2023, 5,537 ha in 2025.
In northern Palawan, the province's densest hotspot loses 8% of its natural forest in one year, 2022, after Typhoon Odette (Rai) crossed the island in December 2021, and little of it has come back since.
Primary forest
Naturally regenerating forest
Tree crops & agroforestry
Other land
Water
Beta dataNorthern Palawan, about 8 by 8 km. Natural forest: 5,525 ha in 2021, 5,101 ha in 2022, 5,122 ha in 2025.
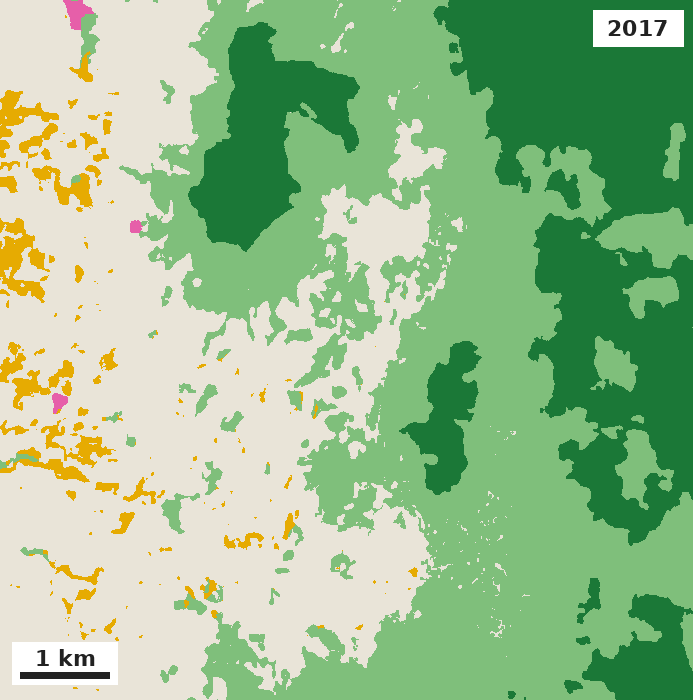
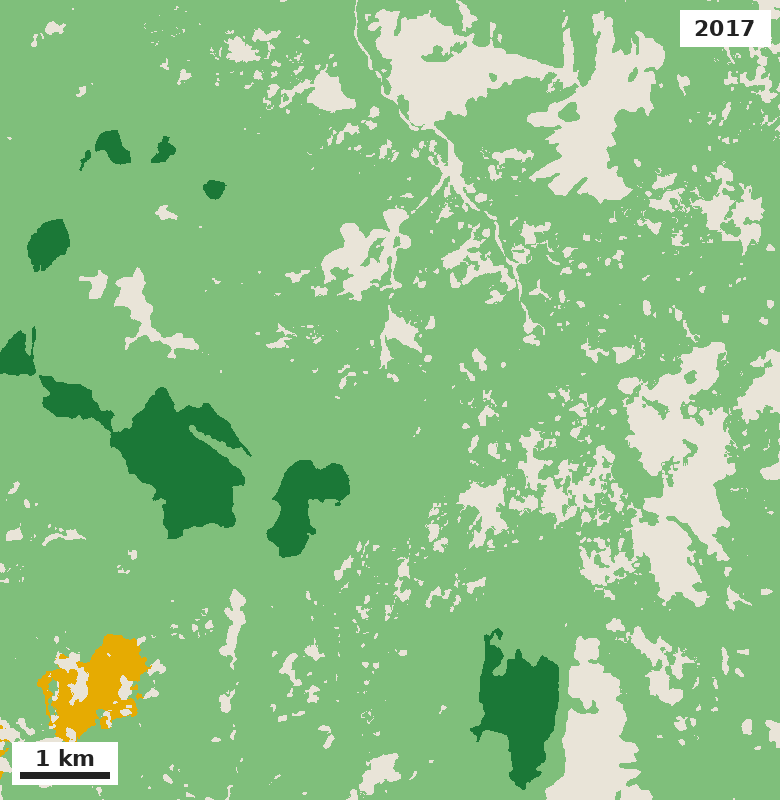
Elsewhere the loss is gradual, a little most years, the pattern of a farm frontier. In Cabanglasan, on the eastern side of Bukidnon, and in Sablayan, in the interior of Occidental Mindoro, open land eats into the forest edge year after year.
Primary forest
Naturally regenerating forest
Plantation forest
Tree crops & agroforestry
Other land
Beta dataCabanglasan, Bukidnon, about 8 by 8 km. Natural forest: 3,520 ha in 2017, 3,240 ha in 2025.
Primary forest
Naturally regenerating forest
Tree crops & agroforestry
Other land
Beta dataSablayan, Occidental Mindoro, about 9 by 9 km. Natural forest: 6,408 ha in 2017, 5,973 ha in 2025.
Tree cover loss is not the same thing
Hansen's Global Forest Change, the dataset behind Global Forest Watch, counts 438,000 hectares of tree cover loss in the Philippines over 2018 to 2024, about four times ForTy's conversion figure. The difference is the point. Tree cover loss includes storms, fires and the harvest of plantations and coconut, much of which grows back. ForTy asks whether the land changed type. Across provinces the two still rise and fall together (correlation 0.91), partly by design: the paper's method uses Hansen's loss data in training to tell the model where change is real.
Beta dataEach dot is a province. The provinces of the four landscapes discussed below are green. Both axes are logarithmic.
The clearest gap is Palawan in 2022. Hansen records 31,600 hectares of tree cover loss in the province that year, the largest single-year figure in its Palawan record since 2001, after Typhoon Odette. ForTy's natural forest in Palawan fell by a net 683 hectares the same year. Behind that net figure, ForTy reads about 4,390 hectares of natural forest as becoming something else, 14% of Hansen's figure, and about 3,710 hectares going the other way. In ForTy's reading, most of the storm-damaged forest is still forest.
Tree cover loss (Hansen)
Net fall in natural forest from the year before (ForTy)
Beta dataPalawan by year, in hectares. In 2023 ForTy's natural forest in Palawan rose slightly, so no red bar shows.
Four landscapes
Primary
Naturally regenerating
Plantation
Tree crops & agroforestry
Other land
Whole-province figures for 2020; in this boundary set Zamboanga del Sur includes Zamboanga City.
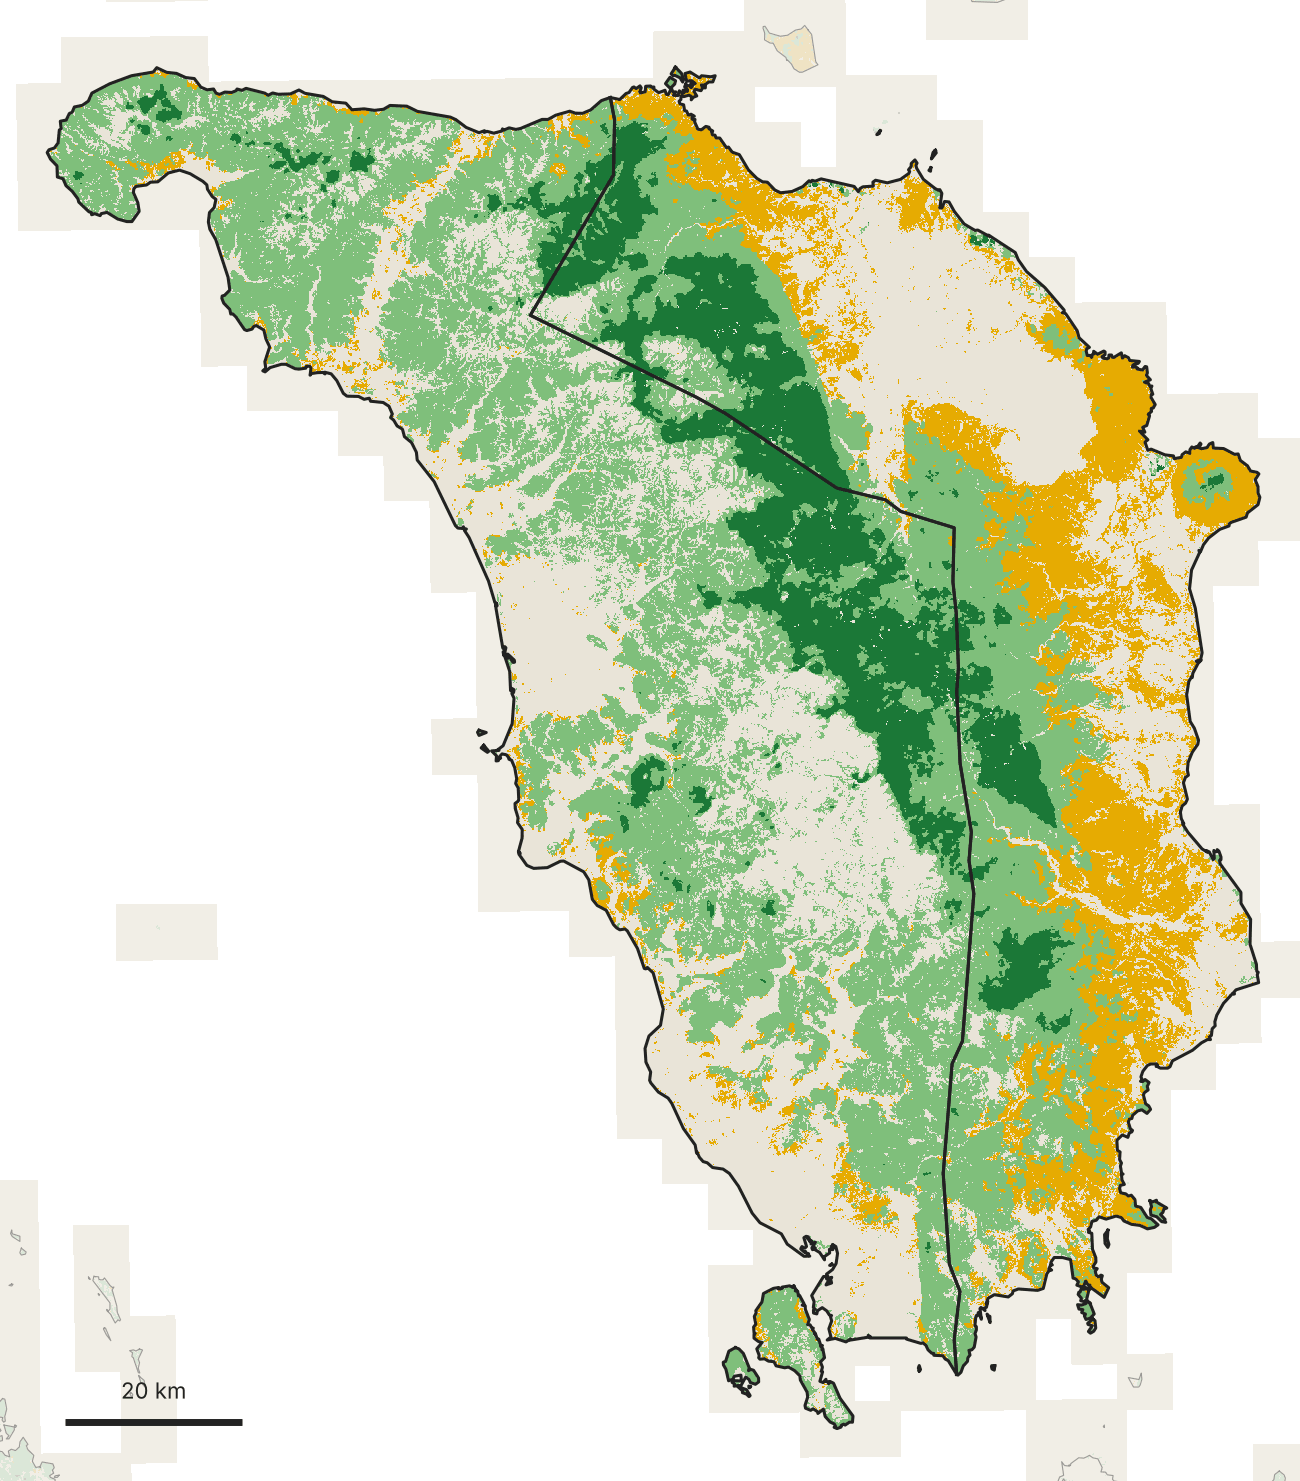
Samar has one of the country's great forest blocks. Across its three provinces ForTy maps about 651,000 hectares of natural forest, 327,000 of it primary, in one band down the island's spine. Toward the coasts the forest gives way to tree crops, much of it coconut: 34% of Western Samar, 57% of Northern Samar. Beta dataIt is also holding. The three provinces together converted 2,050 hectares of natural forest between 2017 and 2025, 0.3% of it, about a third of the national rate.
Primary forest
Naturally regenerating forest
Tree crops & agroforestry
Other land
Natural forest converted
Grown back into natural forest
Natural forest in 2024–25
Other land and tree crops
Western Samar outlined; Northern and Eastern Samar and Leyte faded. ForTy 2020, the most common class in cells of about 75 m, shown at about 140 m per pixel.Beta dataNatural forest converted (red) or grown back (blue) between 2017 and 2025, from Google's early-release annual series. Shading shows the share of 10 m pixels that changed, exaggerated four times so small changes show.
Mindoro splits down the middle. Primary forest follows the mountain spine, and either side of it the island diverges: tree crops cover 29% of Oriental Mindoro and only 3% of Occidental Mindoro, where regrowth (46%) and open land (40%) dominate. Coffee is among the tree crops in Mindoro's uplands; Wovoka's coffee-suitability screening for Mindoro sits next to the forest types in Wovoka Maps. Coffee is an EUDR commodity, so whether a plot was forest in 2020 is the question a buyer will ask. Beta dataOccidental Mindoro ranks 7th in the country for natural forest converted since 2017, 3,390 hectares.
Primary forest
Naturally regenerating forest
Tree crops & agroforestry
Other land
Natural forest converted
Grown back into natural forest
Natural forest in 2024–25
Other land and tree crops
Occidental (west) and Oriental (east) Mindoro. ForTy 2020, the most common class in cells of about 75 m, shown at about 110 m per pixel.Beta dataNatural forest converted (red) or grown back (blue) between 2017 and 2025, from Google's early-release annual series. Shading shows the share of 10 m pixels that changed, exaggerated four times so small changes show.
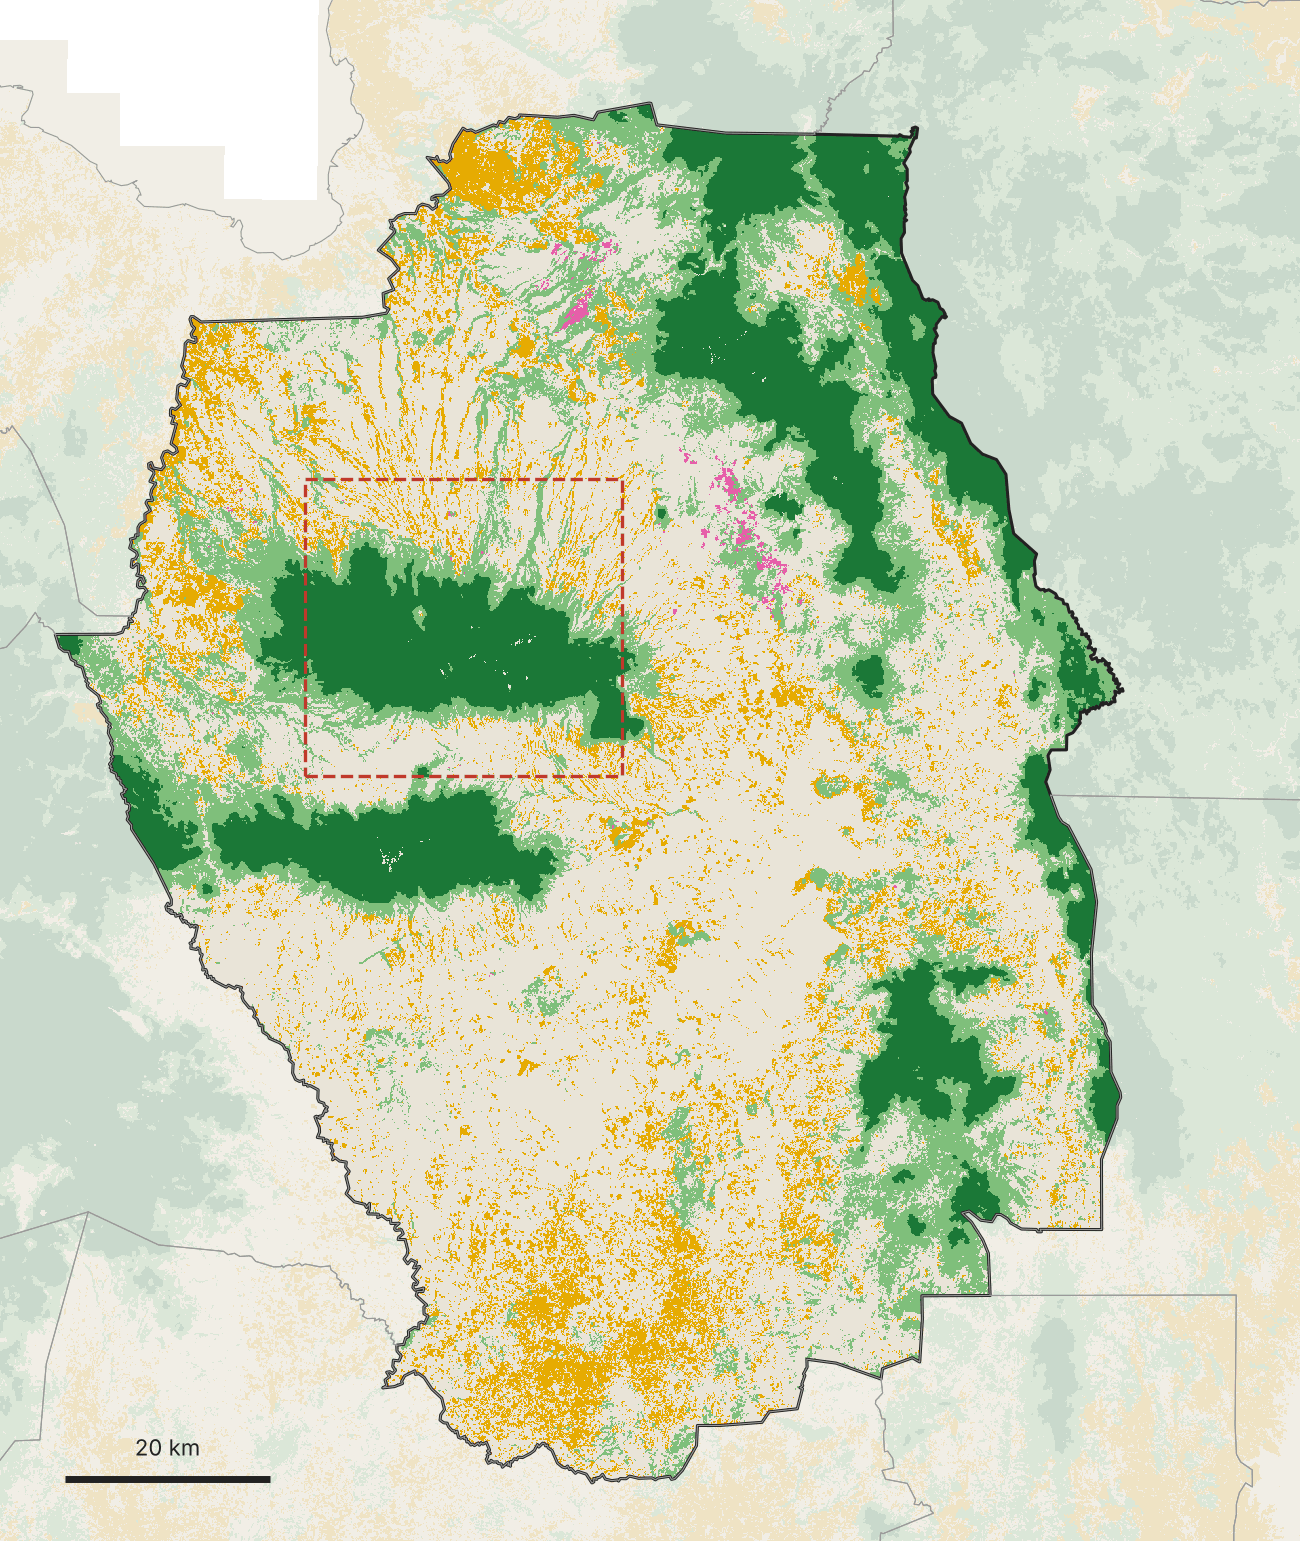
Bukidnon is a farmed plateau with mountain islands. 55% of the province is other land, the 7th-highest share among the 81 provinces: corn, sugarcane, pineapple, pasture. Its 143,000 hectares of primary forest survive on the high ground of Mount Kitanglad, Mount Kalatungan and the Pantaron range, each ringed by regrowth, with forest fingers running down the gullies into the farms. Those mountain slopes are also where Bukidnon's highland coffee grows, between the forest edge and the plateau. Beta dataBukidnon is also where the forest edge is moving. It ranks 4th in the country for natural forest converted since 2017 (4,150 ha) and second for new tree crops (5,610 ha).
Primary forest
Naturally regenerating forest
Plantation forest
Tree crops & agroforestry
Other land
Natural forest converted
Grown back into natural forest
Natural forest in 2024–25
Other land and tree crops
Bukidnon outlined. ForTy 2020, the most common class in cells of about 65 m, shown at about 100 m per pixel. The dashed box is enlarged below.Beta dataNatural forest converted (red) or grown back (blue) between 2017 and 2025, from Google's early-release annual series. Shading shows the share of 10 m pixels that changed, exaggerated four times so small changes show.
Primary forest
Naturally regenerating forest
Plantation forest
Tree crops & agroforestry
Other land
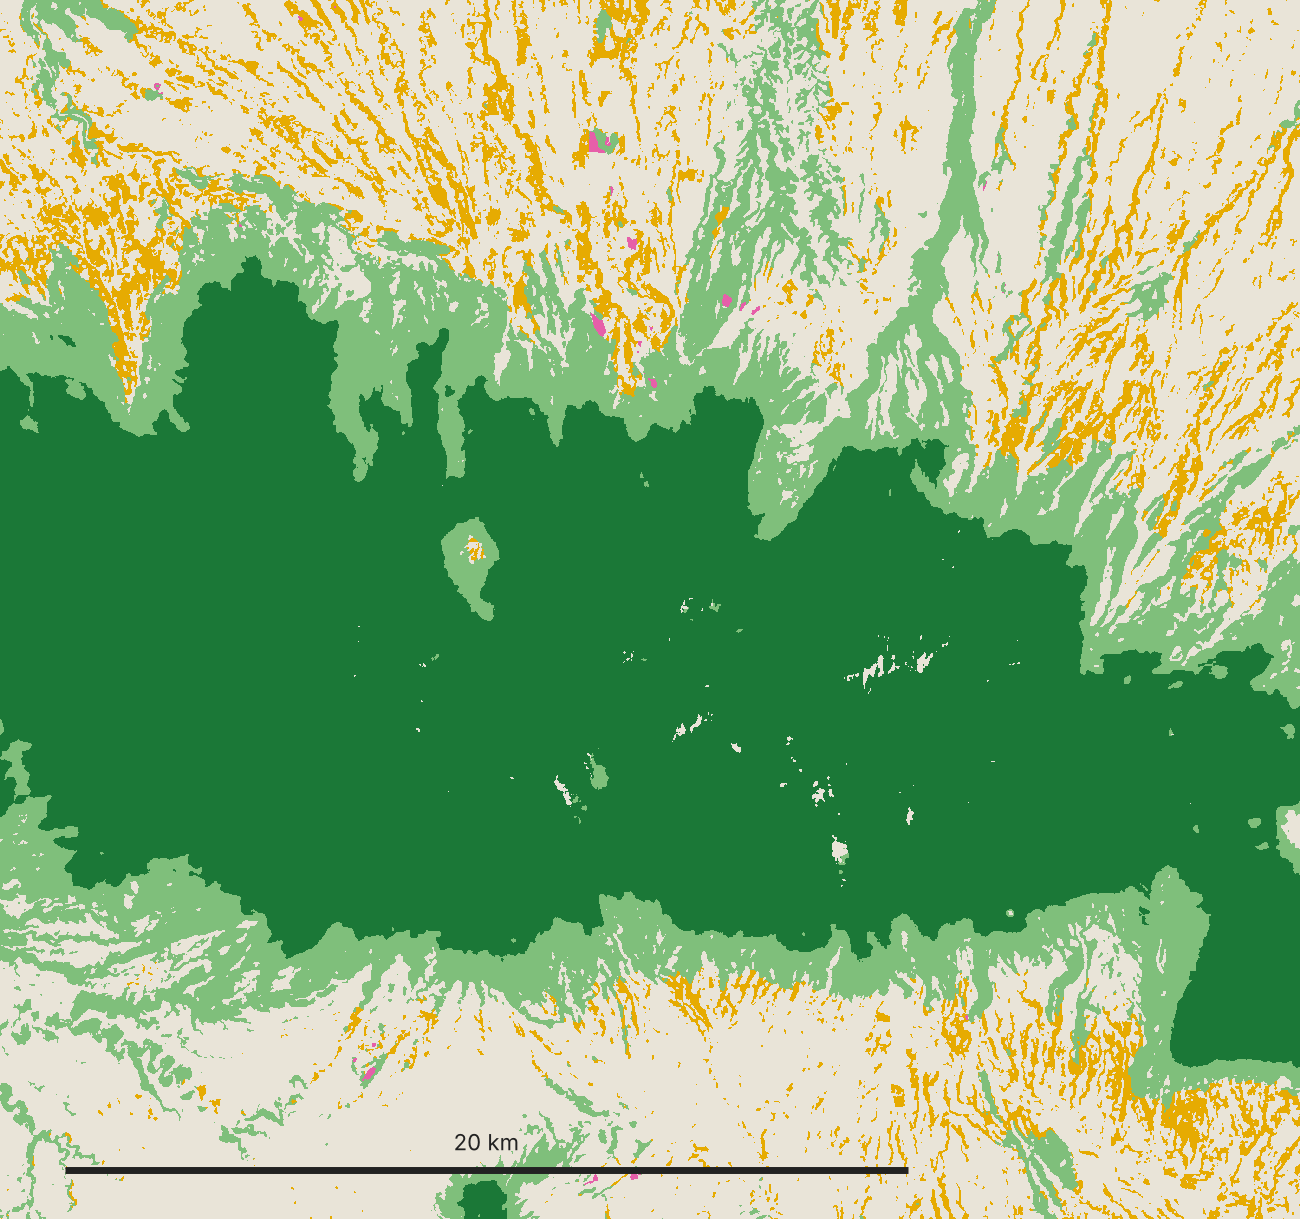
Mount Kitanglad Range in 2020, close up from the 10 m map (about 25 m per pixel as shown). The primary forest edge is sharp; regrowth follows the streams down into farmland.
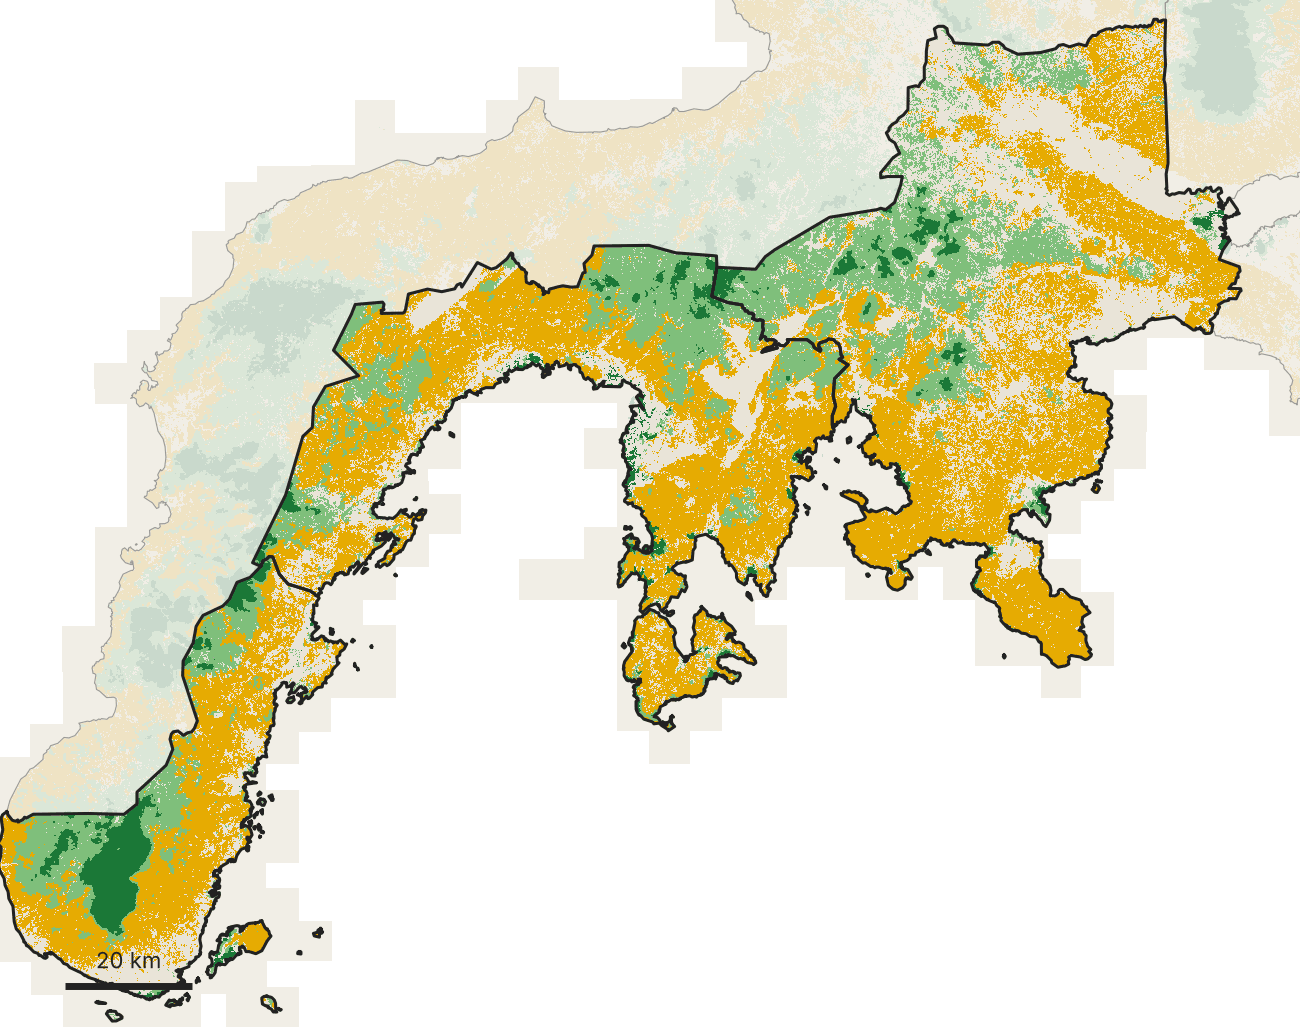
Zamboanga Sibugay and del Sur are tree-crop country: 45% of the land, largely coconut and rubber, with primary forest down to 4.7%. Those figures include Zamboanga City, which this boundary set counts as part of Zamboanga del Sur and which holds almost half of the primary forest (17,800 of 37,800 hectares). Beta dataWithout the city, Zamboanga del Sur converted 2.2% of its natural forest between 2017 and 2025, more than twice the national rate; inside the city the figure was 0.8%.
Primary forest
Naturally regenerating forest
Tree crops & agroforestry
Other land
Natural forest converted
Grown back into natural forest
Natural forest in 2024–25
Other land and tree crops
Zamboanga Sibugay and Zamboanga del Sur outlined (this boundary set includes Zamboanga City). ForTy 2020, the most common class in cells of about 75 m, shown at about 160 m per pixel.Beta dataNatural forest converted (red) or grown back (blue) between 2017 and 2025, from Google's early-release annual series. Shading shows the share of 10 m pixels that changed, exaggerated four times so small changes show.
Their mangroves are another matter. Of the mangrove that Global Mangrove Watch maps in the two provinces in 2020, ForTy reads 69% as natural forest, close to the national 70%. ForTy is not a mangrove map and has not been validated for mangroves; read it next to the Global Mangrove Watch and DENR-PhilSA extents, not instead of them.
Primary
Naturally regenerating
Tree crops & agroforestry
Other land
ForTy 2020 class inside the Global Mangrove Watch v3 2020 mangrove extent (Bunting et al. 2022, CC BY 4.0). Zamboanga del Sur includes Zamboanga City.
Where the map needs people
The paper reports 90.2% overall accuracy across six classes (95.5% for forest versus non-forest), validated against 8,190 expert-labelled sites. The class that matters most in the Philippines is one of the weakest: tree crops score an F1 of 62% globally and 70% in Asia, against 83% for primary forest and 96% for other land. The validation dataset is public, so we pulled the 87 sites that fall in the Philippines, 79 of them with a settled expert label.
Confirmed tree crops (42)
Actually other land (8)
Actually regrowing forest (7)
The 57 Philippine validation sites that ForTy 2020 maps as tree crops and where both expert reviewers gave the same answer. One square per site.
Of the 57 sites ForTy mapped as tree crops where both expert reviewers agreed, 42 were tree crops. 8 were open land. 7 were regrowing forest, and 3 of those 7 are in Western Samar. From orbit, a coconut farm going back to forest and a secondary forest with coconuts in it look much the same. Two other patterns show in our counts. Of all the plantation forest ForTy maps in the country, 79% is in Benguet and Mountain Province, where much of the pine is natural Benguet pine; while the map was being built, its authors found a similar error in Central America, where natural pine was being read as planted forest, and added training labels to correct it. And because there is no planted-forest class in the Philippine map at all, new restoration and agroforestry plantings will likely read as tree crops, regrowth or open land.
That is the line between regrowth and agroforestry, and it is exactly the line that decides restoration eligibility, EUDR exposure and what a native-forest-plus-agroforestry landscape could produce. A satellite cannot settle it. People on the ground can. On Samar, a citizen-science campaign on Ghost Dance, Wovoka's field app, asks people across the island to geotag what is actually growing, including cacao and coffee trees, and where forest has been damaged, so that the places ForTy cannot call become known rather than guessed.
How to use it
As a 2020 baseline, not a verdict. ForTy is an open map that separates natural forest from plantations and tree crops at the EUDR cut-off date. It tells you where to look.
With thresholds. The full product ships per-class relative confidence scores, not just the class. Raise the threshold where a false "forest" is expensive, lower it where a missed one is.
Change as a pointer, not a measurement. The annual series is an early release with no published accuracy. Use it to find where to look, then check the place.
Next to national data. NAMRIA land cover, Global Mangrove Watch, DENR-PhilSA mangroves and Hansen tree cover loss answer different questions; read them together.
With field evidence where the classes meet. Regrowth versus coconut, shaded coffee versus forest, natural pine versus plantation. Those are field calls.
Next: a map taught from the ground Beta data
ForTy says what kind of forest stood where, and its annual series where that forest gave way to something else. Neither says what replaced it in the terms a buyer, a regulator or a community uses. "Tree crops" covers coconut, cacao and fruit orchards alike; "other land" covers a burned slope, a new road and a rice field. A newer kind of satellite data can help close that gap, if it is given labels from the ground.
Satellite embeddings are the output of AI models trained on years of optical and radar imagery, and on other data such as lidar, elevation and land-cover maps. Google DeepMind's AlphaEarth Foundations and the Allen Institute for AI's OlmoEarth each sum up every 10 m of land, for a whole year, as a short list of numbers: 64 for AlphaEarth, 128 for OlmoEarth. The list is a fingerprint of how the place looks and changes through the seasons, and because the models combine many dates and radar, which sees through cloud, they fill the gaps that cloud leaves in any single image. Places with similar fingerprints tend to be similar on the ground. An embedding is not a map. It becomes one when someone teaches it what the fingerprints mean, and that takes labelled examples.
ForTy itself is built on these fingerprints: the model behind its 2020 map reads AlphaEarth, and Google says its annual series applies a similar approach. So it is no surprise that, on land in and around Samar that ForTy's early release shows as natural forest in 2017 and as another class in 2025 (the two single years, without the two-years-running test used above), the AlphaEarth fingerprint moved about three times as much between those years as in forest that stayed forest. The telling part is where it barely moved. Where the forest is said to have become other land, the fingerprint moved 3.6 times as much as in stable forest; where it is said to have become tree crops, only 1.2 times, little more than forest that did not change. The fingerprint changed little there, yet the map changed class. Either a real change hides under a canopy that stays green, or the label changed while the land did not. Sharp imagery can settle some of these cases; what grows under a canopy usually takes someone standing there to say.
The day after the Allen Institute released OlmoEarth v1.3 on 22 October 2026, we put it side by side with AlphaEarth on Samar. Its makers report that its 128-number version scores highest on 20 of their 27 evaluations, against AlphaEarth and Tessera v2. Our test was local: the same 2024 pixels in 32 areas of land, each 2.56 km across, in all three of the island's provinces (19 of them in Eastern Samar); the same simple classifier; and each model scored only on areas it had not been trained on. The task was to reproduce the four classes ForTy's 2024 early release draws on Samar: primary forest, regenerating forest, tree crops and other land.
AlphaEarth Foundations (Google DeepMind)
OlmoEarth v1.3 (Allen Institute for AI)
Both together
Beta dataHow often each embedding agrees with ForTy's 2024 early-release classes on Samar areas it was not trained on (balanced accuracy), against the number of labelled pixels per class. 32 areas of land, 4-fold cross-validation by area, training pixels drawn 3 times; each point is the mean of 12 scores, which vary by 1.4 to 3.9 points (standard deviation). Agreement with another map, not accuracy on the ground; ForTy's 2020 model reads AlphaEarth, and ForTy's annual series most likely does too, which would tend to favour AlphaEarth here.
On average, AlphaEarth agreed with ForTy more often than OlmoEarth at every amount of training data, by 1.6 to 3.1 points. That is what you would expect if the map being matched is built on AlphaEarth, though the test cannot say how much of the gap that explains, and the lead was not steady. It held in all four groups of held-out areas at 100 and 500 pixels per class but not at 25 or 2,000, and when a whole part of the island was held out at a time, OlmoEarth drew level on average at 500 and 2,000: AlphaEarth still led in three of the four parts, by 1 to 6 points, but OlmoEarth led by 8 to 11 in the north-west. That OlmoEarth, trained separately, came this close to what is most likely the map's own input is the more telling result. Using both together added up to 1.7 points more than AlphaEarth alone, and up to 3.5 when whole parts of the island were held out, most of it in the north-west: a hint that combining two embeddings built in different ways hedges against either one doing badly in a place it has not seen.
The bigger lever was the labels. Going from 25 to 2,000 labelled pixels per class raised agreement by 9 to 11 points for every model, against 1.6 to 3.1 points between the two embeddings, and most of that gain had come by 500 per class. Regenerating forest was the hardest class for every model at every size: at 500 labelled pixels per class, AlphaEarth's F1 score was 66% for regrowth, against 78% for primary forest, 78% for tree crops and 88% for other land. Most of the misses, 83%, were between neighbours on one gradient, from primary forest through regrowth and tree crops to other land: it called 19% of ForTy's primary forest regrowth and 16% of its regrowth primary forest, 13% of its regrowth tree crops and 17% of its tree crops regrowth. ForTy's own checks of its 2020 map find it going wrong along both lines: among its Philippine validation sites are regrowing forests it mapped as tree crops, as shown above, and its authors report that across Asia it maps more primary and less regenerating forest than their sample-based estimate.
The test scores agreement with another map, not with the ground, and it cannot say which embedding is better on Samar, because the answer key was most likely drawn with one of them. What it does show is that more labels moved agreement further than a change of embedding, and that most of the misses, 70% of AlphaEarth's, sit on either side of regrowth: between primary forest and regrowth, and between regrowth and tree crops. Labels from the ground are what would show whether those misses belong to the model or to the map.
Gathering such labels has begun on Samar. The island's three provinces converted 2,050 hectares of natural forest between 2017 and 2025, 81% of it to other land and 19% to tree crops. Every patch of at least half a hectare, with 100 m added around it, is now marked in Ghost Dance, Wovoka's field app: 637 areas covering about 9,300 hectares, most of it the margin around the patches. Its quest "What replaced the forest?" asks people on Samar to go to one they can reach safely (from a road or trail is fine), photograph the land and answer two questions: what is here now, and when did the forest go. The answers run from cleared, burned or logged ground, through coconut, abaca or banana, other crops or farms, tree plantations, and quarries, mines, roads or buildings, to young trees growing back and "still forest", and either question can be answered "not sure". The "still forest" answer matters as much as the others: where the photo shows the converted patch itself rather than the margin around it, it points to a place where the map may have changed and the land did not. That answer does not say which kind of forest stands there, so the line between primary forest and regrowth, where 36% of AlphaEarth's misses above fall, will need other checks. The quest tells people never to go onto land where they are not welcome and never to confront anyone, and asks for photos of the land only, with people kept out of them. Answers that members of the public send from the marked areas wait for a manager's review.
Each approved answer other than "not sure" becomes a label of the kind the test above lacked: one drawn from neither model. Because the quest sends people only to the marked areas, in and just around the patches where the map says forest was lost, and only to those they can reach safely, the answers test the map's change calls and their edges first; a fair verdict between the embeddings across Samar will also need ground labels from a random sample of the whole island, including land far from any mapped loss. With enough answers, it becomes possible to test whether a model can tell apart what ForTy's classes lump together or confuse: coconut from abaca or banana, a burned slope from a new farm, regrowth from an old coconut stand; and, roughly, whether the series has the year of the loss right, since the quest asks only whether the forest went this year, 1 to 3 years ago or more than 3 years ago. AlphaEarth covers the whole country at 10 m for every year since 2017, so a model trained on Samar can then be tested, and corrected, wherever the same fingerprints appear, and every disagreement between the model, the map and the field shows where to look next.
The aim is a land-use model for the Philippines that improves as the answers come in: satellites to see the land, models to read it, and the people who live on it to say what is true.
ForTy 2020 is now a layer in Wovoka Maps, alongside Sentinel-2 imagery and terrain. If you need the same read for your own landscape or supply base, start a conversation.