
The Ground Under the Trees
Google's new GEM-15 model maps the bare earth of the tropics at 15 m. When it came out, users pointed to seams and missing tiles over dense forest, and Google itself says the bare-earth model is weakest under dense canopy. We fixed what can be fixed with open data in our Philippine project areas, measured how far it gets us against 76 field plots, and publish the script. Run it on your own forest and tell us what you find.
Why the ground matters
Two numbers decide a lot in a reforestation project, and both rest on knowing where the ground is. The first is slope. Philippine forestry law (PD 705) treats land at 50% slope and over as forest land to be kept under cover, and project screens for the Verra VM0047 method use the same line. The second is canopy height, the surface minus the ground, which says whether land already carries trees over 5 m.
Until this year the free global elevation models were 30 m radar surfaces such as Copernicus GLO-30. Radar sees the canopy, not the ground beneath it. This year Google published GEM-15: a surface model and a bare-earth model at 15 m for the tropics, from imagery taken 2022 to 2024, under CC BY 4.0. It is a large step. It also shows two artefacts in our project areas that matter for those two numbers.
- Steps between image patches. GEM-15 is assembled from many scenes. Neighbouring patches can sit 1 to 2 m apart in height, which adds false slope along their edges.
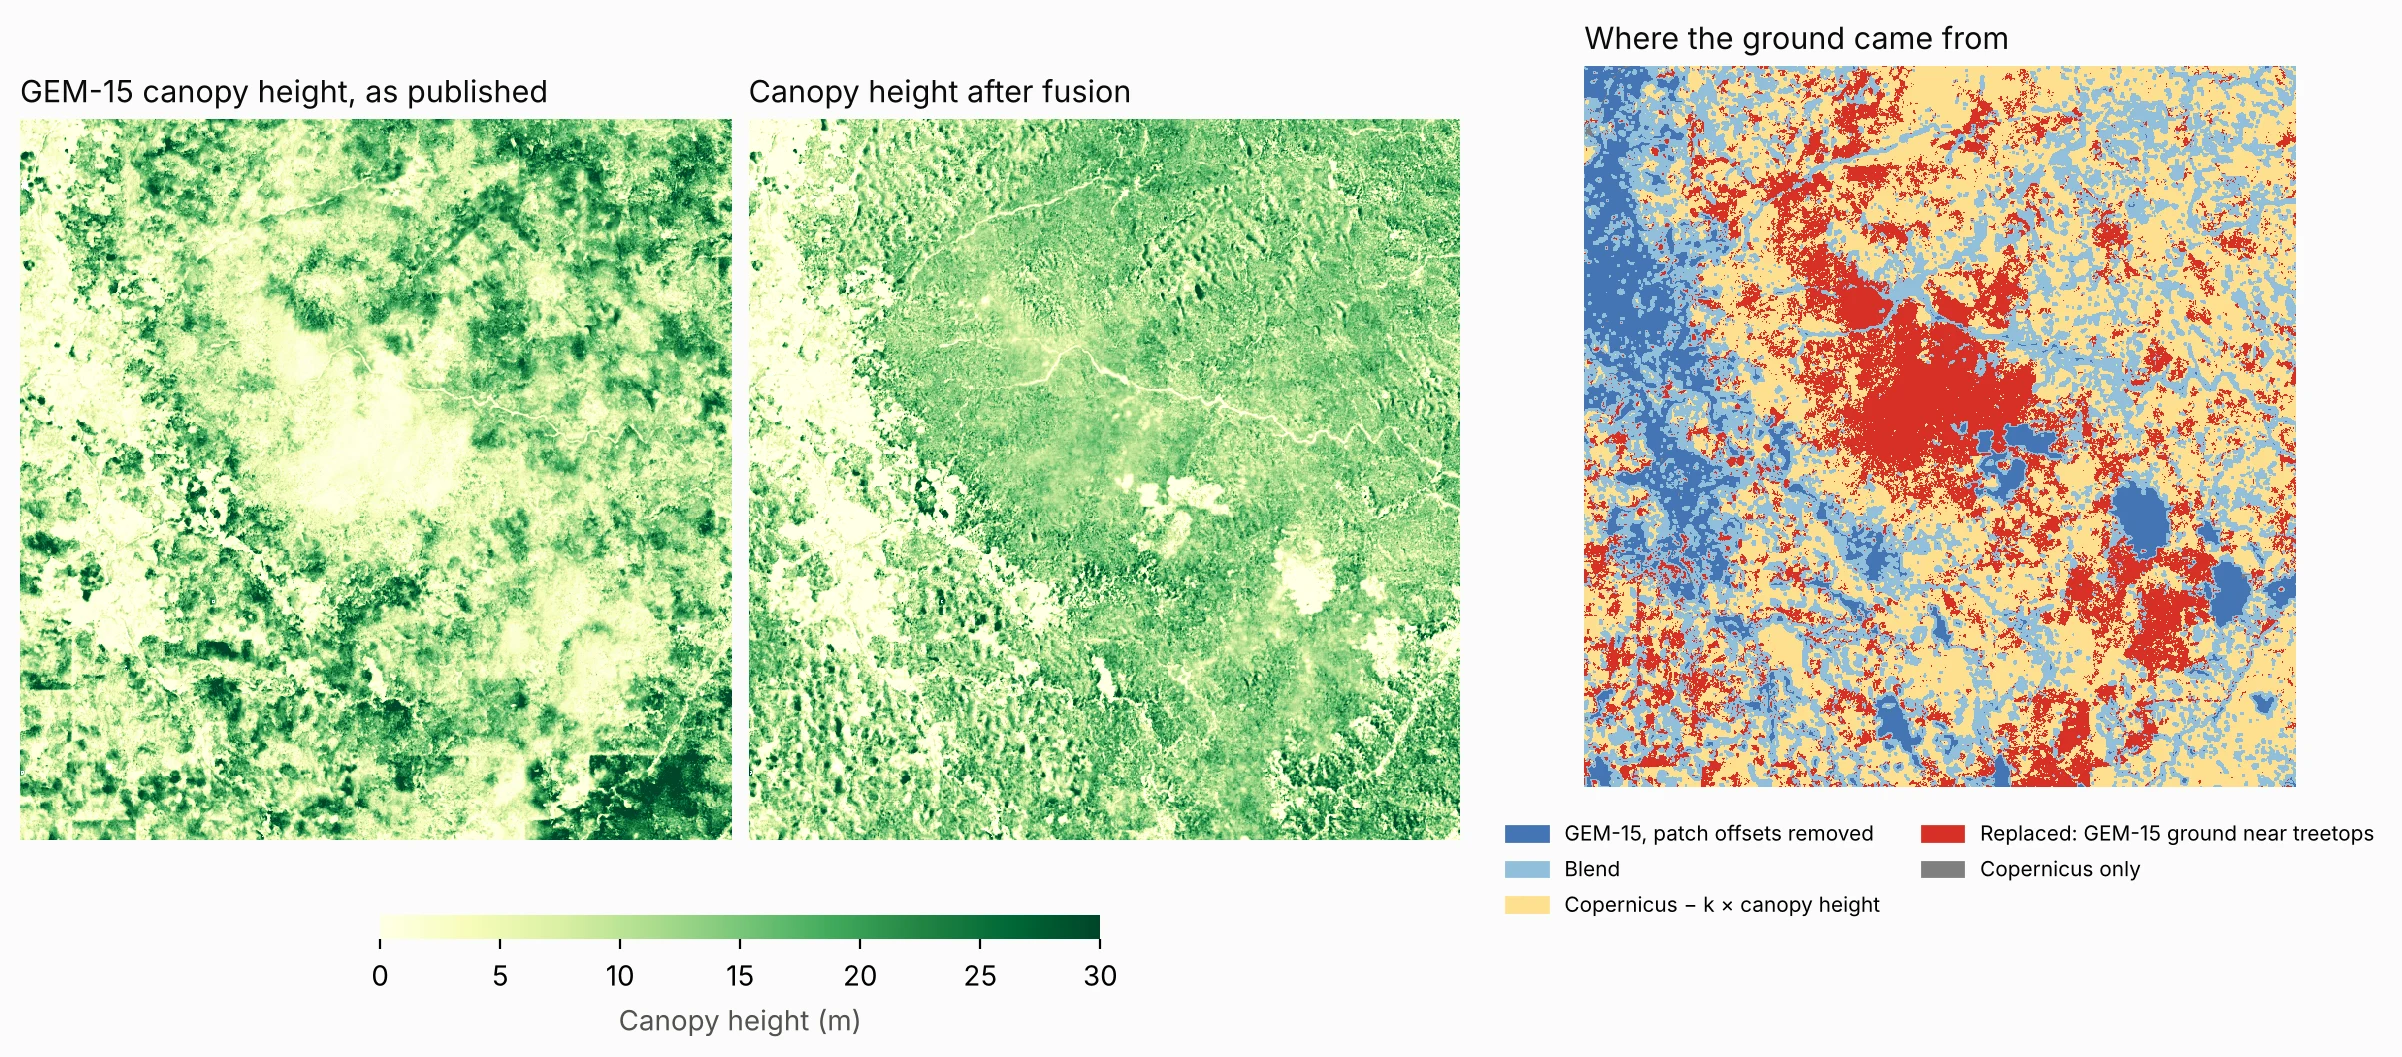
- Ground near the treetops. Under part of the tall canopy, the bare-earth model follows the surface closely, so canopy height reads near zero. Across our five windows this affects 14% to 42% of land with canopy over 10 m.
The recipe: three open datasets, three steps
Everything below uses data that may be shown on commercial maps with credit: GEM-15 (CC BY 4.0), Meta and the World Resources Institute's 1 m canopy height map (Tolan et al. 2024, CC BY 4.0) and Copernicus GLO-30 (free and open). We left out FABDEM, which Google's own viewer falls back to, because its licence is non-commercial.
- Remove the patch steps. On open ground, where both models should see bare earth, take the median difference between GEM-15's ground and Copernicus in 450 m blocks. Fill the gaps, smooth it and subtract it. The correction follows the patches, not the terrain.
- Learn how far the radar sits below the treetops. Copernicus does not see the top of the canopy either: X-band radar settles part way into it. Where GEM-15's own ground looks sound under trees, fit one number, k, in Copernicus − ground = k × canopy height. It came out between 0.36 in mangroves and 0.75 in upland forest.
- Blend by canopy height. Keep GEM-15's corrected ground where canopy is under 5 m. Under canopy over 15 m, and wherever GEM-15's ground sat near the treetops, use Copernicus − k × canopy height. Blend in between.
We ran it for five windows in provinces where we work: Mindoro, Bukidnon, a forest core on Samar, mangroves in Zamboanga Sibugay and a coastal area of Camarines Sur. Each window takes a few minutes.
Did it work? Three tests
1. The fallback ground, on pixels it never saw
We split each window into a checkerboard of 450 m blocks, fitted k on one half and tested it on the other, under canopy over 10 m where GEM-15's ground looks sound. Our fallback missed GEM-15's ground by a median of 2.7 to 4.4 m. Taking the radar surface as the ground misses by 5.2 to 13.6 m, and subtracting the full canopy height overshoots, missing by 5.5 to 7.8 m.

2. The patch steps
Measured on alternate pixels to the ones used to fit the correction, the median offset between GEM-15's ground and Copernicus on open ground fell from 0.9–2.1 m to 0.2–0.5 m. Sharp steps of more than 3 m between neighbouring blocks fell less: from 1.1–6.6% of block edges to 0.7–5.4%. Some of those are real terrain.
3. Against trees measured in the field
Field teams measured trees in 76 plots: 50 in Mindoro in June 2026, 18 mangrove plots in Zamboanga Sibugay in October 2026 and 8 in Camarines Sur in 2024. We compared the tallest tree in each plot with the tallest 15 m pixel within 45 m of its centre.
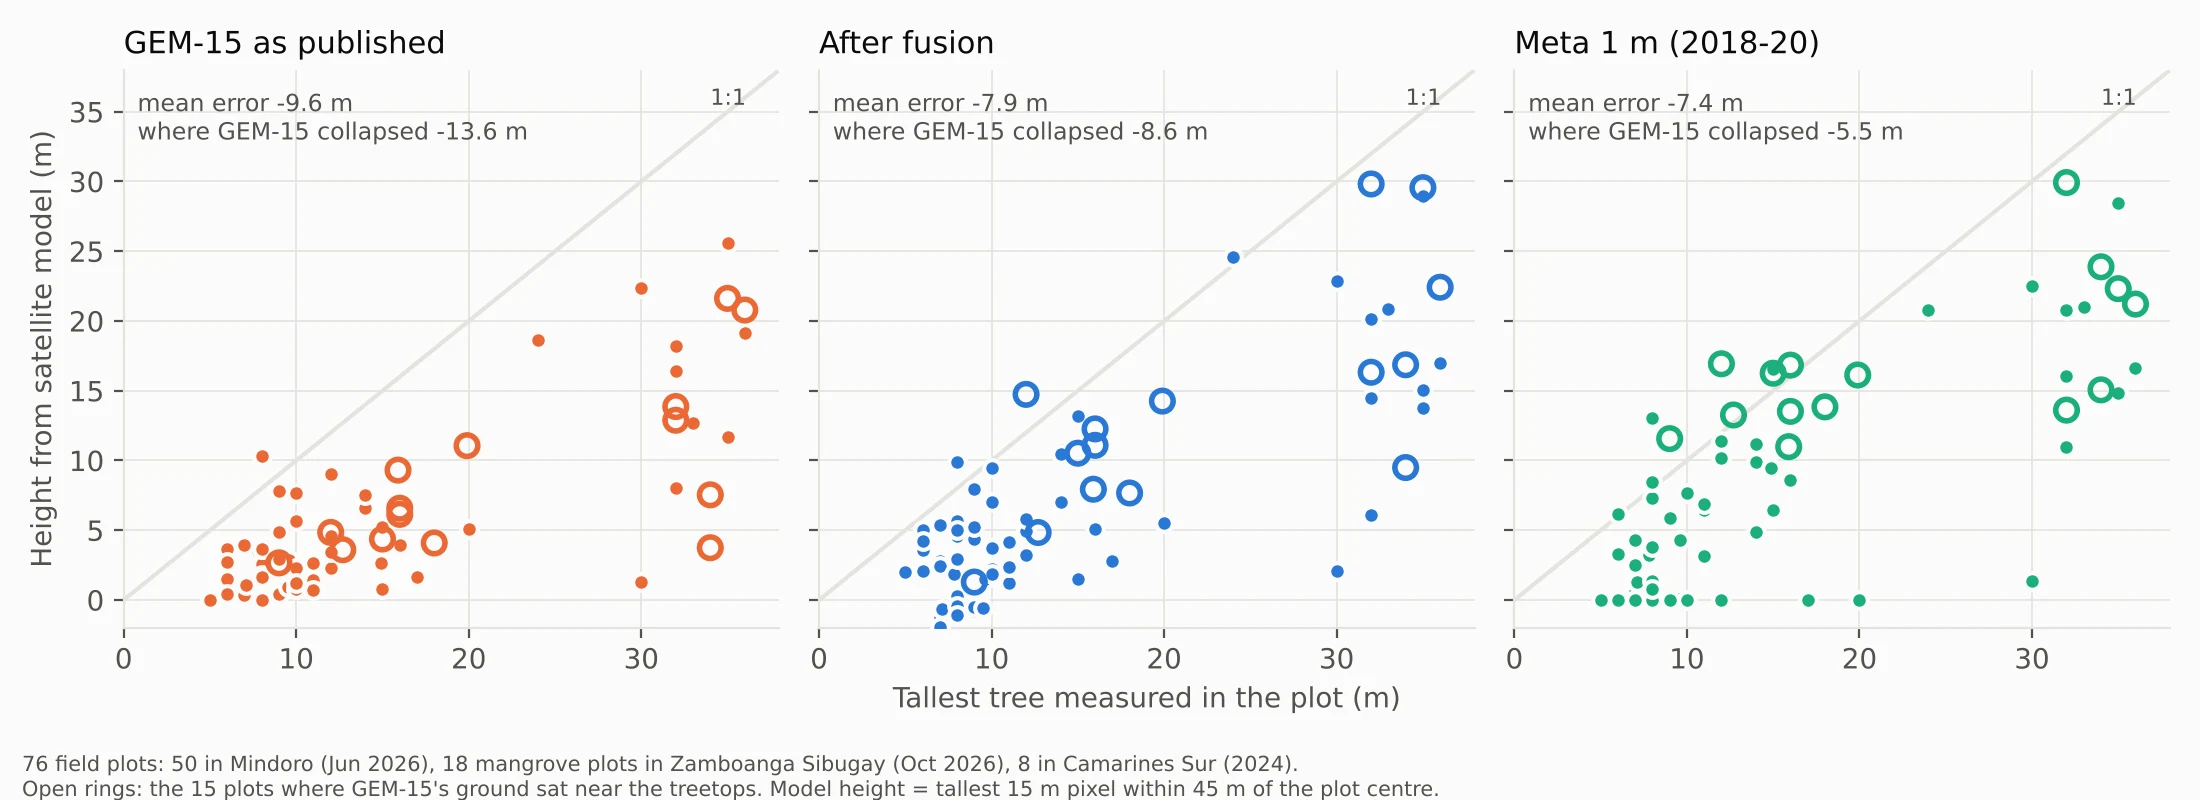
This is the test that keeps us honest. Every satellite model reads 5 to 10 m below the tallest measured tree, more so in tall forest. Fusion helps most where GEM-15 failed: on those 15 plots the mean error falls from −13.6 m to −8.6 m. Elsewhere it changes little. Meta's map, on its own, is about as close to the plots as the fused result.
So the fusion is not a new measurement of the canopy. Under tall forest its ground, and so its canopy height, largely repeats Meta's map. What it does is remove two artefacts, so that slope and the “trees over 5 m” check are not thrown off by them.
What it changes on the ground
In a 36 by 44 km window in Mindoro, the share of land at 50% slope and over, measured at 30 m, is 33.1% from Copernicus, 36.9% from GEM-15 as published and 36.1% after fusion. A finer ground model finds more steep land than the radar does, and the fusion takes back a little of what came from patch steps. In Bukidnon the same figures are 22.6%, 26.0% and 25.7%. On a planting design, those points of slope are hectares that move across the legal line, which is why we check them on the ground before they go into a plan.
| Window | k | GEM-15 ground near treetops, % of canopy >10 m | Held-out ground error, ours vs radar as ground (m) | Patch offset, before → after (m) |
|---|---|---|---|---|
| Mindoro | 0.59 | 24.1 | 3.8 vs 9.5 | 1.38 → 0.38 |
| Bukidnon | 0.75 | 13.7 | 4.4 vs 13.6 | 2.12 → 0.45 |
| Samar (forest core) | 0.73 | 21.9 | 4.1 vs 12.3 | 1.09 → 0.23 |
| Zamboanga Sibugay (mangroves) | 0.36 | 42.4 | 2.7 vs 5.2 | 0.88 → 0.23 |
| Camarines Sur | 0.59 | 33.8 | 2.8 vs 8.0 | 1.06 → 0.28 |
Run it on your area
The script is about 150 lines of Python. It reads all three datasets from their public cloud copies, so there is no account, key or download to set up first.
- Get it. Download gem15_fuse.py (MIT licence). It needs Python 3.9 or later.
- Install three packages.
pip install rasterio numpy scipy - Give it a box and a name. West, south, east and north in degrees, inside one whole-degree cell (GEM-15's tiles are 1° by 1°):
python3 gem15_fuse.py 125.20 11.60 125.45 11.85 samar
A 25 km box takes a few minutes on a laptop. - Open what it writes. Three GeoTIFFs on GEM-15's 15 m grid, ready for QGIS or any GIS:
samar_ground.tif: the fused bare ground, in metres;samar_canopy.tif: canopy height, the GEM-15 surface minus that ground;samar_source.tif: where each pixel's ground came from (1 GEM-15, 2 blend, 3 fallback, 4 replaced, 5 Copernicus only).
samar_report.json: your k, the share of tall canopy where GEM-15's ground collapsed, and the held-out test.
Before you rely on it, check three things. k changes with forest type, so let the script fit it for your area rather than copying ours. Meta's imagery is mostly 2018 to 2020 and GEM-15's 2022 to 2024, so recent clearing or regrowth will disagree. And test it against field plots if you have them: compare the tallest measured tree with the tallest 15 m pixel within 45 m of the plot centre.
Tell us what you find
Five windows in one country is a start, not an answer. We would like to know how k and the collapse share behave in other forests: the Amazon and the Congo, where the gaps were reported, peat swamp, dry forest, and other mangroves. If you run the script, send your report.json to hello@wovokagroup.com with the subject GEM-15 results, with a line on the forest type and, if you can share them, plot heights. We will add each result to a public table on this page, credited to you unless you ask otherwise, and send the comparison to Google's GEM-15 team. Improvements to the script are just as welcome.
Help with the tools
We use these layers in Wovoka Maps, built by Wovoka, the natural capital operator in our group. For help running the script or using the tools, write to maps@wovoka.io.