
Days, Not Years: An Early Estimate of Verra's Deforestation Baseline, Tested in Cambodia
A deforestation baseline that follows Verra’s method, runs on open data in days, is free to use, and is checked in public against Verra’s own maps. Cambodia is the first test.
Executive summary
A forest carbon project cannot start until someone says how much forest its country loses each year. Under Verra's current rules that number comes from Verra's own map of each country, which takes one to two years per country to build; most of Asia and Africa still has none. Wovoka has built a way to produce an early estimate of that map in days, on open data, following Verra's published method, and gives it away free. The estimate is always labelled as ours, never as Verra's.
We tested it the only honest way: we ran it blind in Cambodia, the one country near us where Verra has published a final map, wrote our numbers down, then opened Verra's files and compared.
- How much. Read under Verra's own plot rules, our national figure came to 198,000 hectares cleared a year against Verra's 190,347, within 4%.
- Where. Across 224 cells of 100,000 hectares the two maps rank the risk the same way (rank correlation 0.86), with the same seven provinces on top.
- What it took. One night of computing on a single cloud machine, 2,010 satellite plots read by an AI, and a morning re-reading the doubtful ones under Verra's rules.
Two things made the difference, and both are general: adopt the country's own definition of forest before anything else, and read the sample plots the way Verra's rules require rather than counting every pixel that changed. Human second reads of the plots come next and will tighten the number further. We are now running the same test in other countries where Verra has published, and will report each one, including where we are wrong.
Introduction: why "how much forest is being lost" is a hard question
It sounds like something a satellite should answer in an afternoon. It is not, for three reasons that anyone reading a forest project's numbers should know.
Every country defines forest differently. A forest is not a thing a satellite sees; it is a rule a government writes. Cambodia counts land as forest at 10% tree-crown cover with trees at least 5 metres tall. The Democratic Republic of Congo's Mai-Ndombe province uses 30% cover and 3 metres. In open, dry woodland a 10% line is one that no eye can draw from a picture, and whether a hillside is "forest" or "not forest" turns on it. The same satellite image gives a different answer in each country, and a project's baseline inherits that answer.
Loss is judged on small plots under strict rules, not by counting pixels. Verra's method does not add up every pixel that changed colour. It draws a sample of half-hectare plots, has trained people look at ten years of imagery for each one, and asks a narrow question: was this forest at the start of the period, and is it below the forest line at the end? Logging that leaves canopy, fire that thins woodland, a river that moves, a cloud over the start-year picture, all look like loss to an automatic map and are not loss under the rule. In Cambodia the automatic forest-change maps saw only half of the clearing the plots found; in other forests they count change that is not clearing at all. Only the plots say which.
The answer is two numbers, and they fail differently. One is the level: hectares lost per year across the whole country. The other is the pattern: where that loss is most likely next. A project's credits depend on both, and a method can get one right and the other wrong. That is why Cambodia below reports both, and why human second reads of a few hundred plots are the step that turns a days-old estimate into one a buyer can rely on.
With that in hand, the sections that follow explain what Verra does, what we built, and what happened in Cambodia. The two sections marked "Technical details" fold closed on the website and open on a click.
The problem: the baseline that decides a forest project now takes years to arrive
Since 2023, a REDD+ project under Verra's VM0048 methodology no longer sets its own deforestation baseline. Verra does. For each jurisdiction Verra contracts a data provider to measure ten years of forest loss from a sample of satellite plots, build a risk map with its allocation tool (VT0007), and hand every project inside that jurisdiction its share of the national loss. That is a real improvement: the old project-by-project baselines were the main reason REDD+ credits lost the market's trust.
The cost is time. Each jurisdiction takes a provider one to two years, and Verra publishes them one at a time. As of November 2026 the open-access list holds eight countries: Cambodia, Colombia, Peru, Guatemala, five Brazilian states, two provinces of the Democratic Republic of Congo, one region of Tanzania and a provisional Papua New Guinea. Indonesia, Malaysia, Vietnam, Laos, most of Africa and the Philippines have nothing published yet.
Until the map exists, nobody can answer the first question a landowner, a community, an investor or a buyer asks: roughly how many credits could this forest earn? Projects stall at the feasibility stage, capital waits, and the forest keeps going while everyone waits for a number.
What we are building: a free early estimate of Verra's map, for any country, in days
Wovoka is building a deforestation-risk layer that follows Verra's published method step by step, runs on open data, and is free to anyone who wants to screen a site. We run it before Verra's map exists, and we check it against Verra's map wherever one has been published. The goal we set ourselves: land within about 20% of Verra's eventual national figure and put the risk in the same places. Cambodia, below, is the first test against a final map; the 20% is a target we report against, not a result we claim.
Three choices make it fast without making it loose:
- Same method, open inputs. The steps are Verra's own (VMD0055 Appendix 1 and VT0007, checked against Verra's reference code). Only the inputs change: Google DeepMind's ForTy forest typology and AlphaEarth embeddings, the JRC tropical moist forest history, Hansen loss, Sentinel-2 and Landsat archives, Esri's dated high-resolution imagery. All public.
- A real sample, read by AI first and people second. Verra's number comes from humans reading about a thousand plots. Ours comes from one to three thousand plots read first by a language model that looks at the same pictures a human would, then checked by people on a web page built for the job. The AI read gives a national figure in a night; the human reads tighten it over the following weeks.
- A published comparison, every time. Each country we run gets a blind result first, then a side-by-side with Verra's map when it arrives: national total, per-province totals, and rank agreement across 100,000-hectare cells. The gaps tell us which step to fix.
The layer is always labelled as Wovoka's estimate, never as Verra's map. It does not replace Verra's baseline and it is not a credit forecast. It is the number you need on day one, with its uncertainty attached, so that the two-year wait is not a two-year blank.
How it works, Verra's eight steps run on open data in about three days
In short: we run Verra's own eight steps, from the forest map to the risk allocation, with public satellite data and an AI reading the sample plots, then hand the plots to people.
Open the technical details
The pipeline is one script per country. A new country needs its bounding box, an equal-area projection, its first-level administrative boundaries and its forest definition; everything else is fetched. The steps are Verra's, in Verra's order.
- Periods. A ten-year historical reference period split in two (for most of South-East Asia 2012-2016 and 2017-2021), then a six-year baseline validity period. Verra's jurisdiction table says which years apply.
- Forest benchmark map. Forest or not at the start, middle and end of the period, at 10-30 m, under the jurisdiction's own forest definition (Cambodia: 10% canopy, 5 m, 0.5 ha). We build it from AlphaEarth embeddings classified against our own plot reads, with ForTy separating natural forest from tree crops and plantations, and the JRC and Hansen archives for the change years. This step decides most of the result, as Cambodia showed.
- Exclusions. Mangroves and the intertidal zone (Global Mangrove Watch), commercial plantations (ForTy), large natural disturbances (a major typhoon's track, for example), planned clearing. Loss inside them is reset to non-forest and earns no risk.
- The sample. Seven strata drawn from the benchmark map: mapped loss in each half, stable forest near and far from an edge, stable non-forest near and far from forest, and loss the Hansen record sees where the benchmark sees no forest. 1,400 to 3,000 plots. For every plot a panel is rendered: yearly Landsat from 2011, yearly Sentinel-2 from 2017, dated Esri high-resolution scenes, the ForTy class. A language model reads each panel under Verra's rule (half a hectare, forest at the start under the 10% line, below it at the end) and records forest, non-forest, cleared in the first half, cleared in the second half, or unsure.
- The national number. The stratified estimator from VMD0055 turns the reads into hectares cleared per year with a 90% confidence interval, and applies Verra's discount when the interval is wider than 10%. This number, not the map count, is the activity data. In Cambodia the map count was half of what the sample found; elsewhere a change product can run several times too high. The sample catches both.
- The risk model. Distance to the forest edge sets Verra's benchmark model; we also fit a logistic regression and a gradient-boosted model on edge distance, roads, elevation, slope, forest type and province. Each is tested the way VT0007 requires: fit on the first half, predict the second, score by median absolute error per 100,000-hectare cell, and keep an alternative only if it beats the benchmark on both tests.
- Allocation. The winning model spreads the national number across the forest at the end of the period, capped per pixel, so that any polygon drawn on the map returns its expected clearing per year.
- Humans in the loop. The plot panels go to a web page (Check a plot) where foresters and ecologists read them again, blind to the first read. Where two human reads disagree with the AI, the label changes, the estimator reruns, and the layer is rebuilt under a new version. The map improves without a new build of anything else.
Steps 1 to 7 ran for Cambodia in one night on a single cloud machine, most of it waiting for imagery downloads. Step 8 is where the days become weeks, and where the number earns trust.
Cambodia, run blind, then compared with Verra's final map
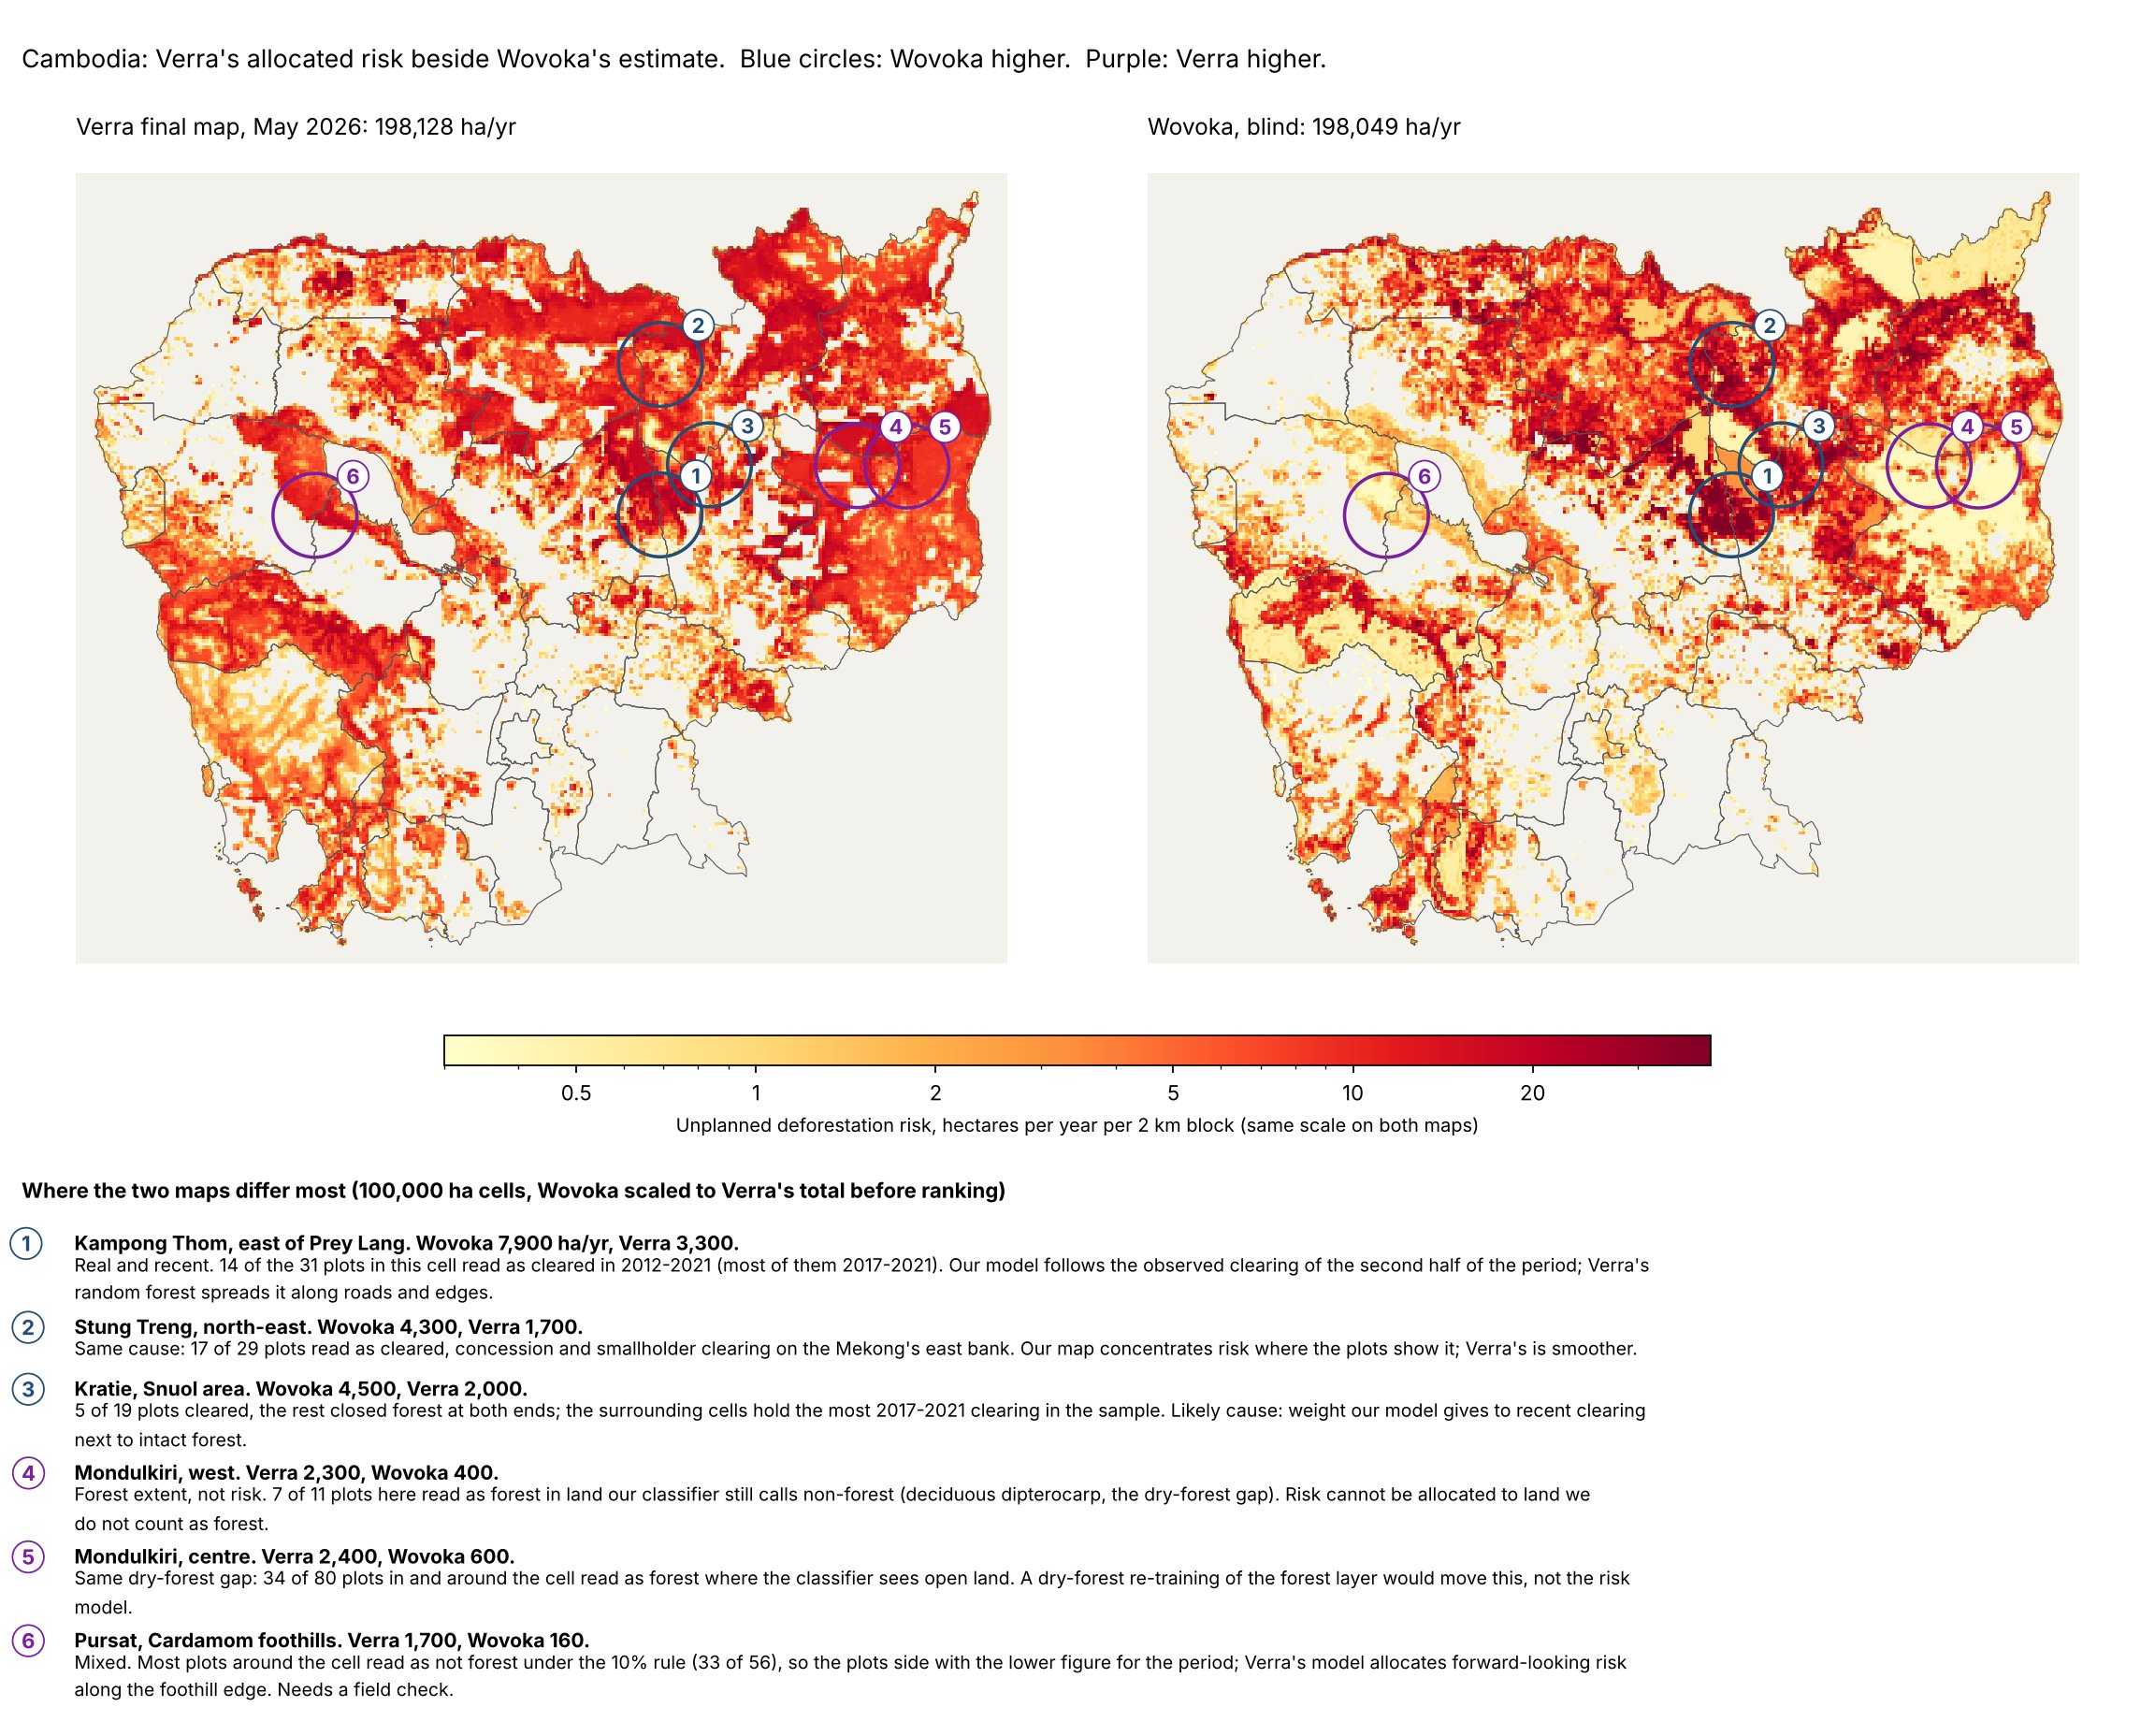
In short: on the first night our map found half of Verra's forest and our sample ran 25% high; adopting Cambodia's forest definition and reading the plots under Verra's rule brought the level to within 4% and the pattern to 0.86. The two maps are shown side by side below, with the places we differ circled and explained.
Open the technical details
Cambodia is the one Verra jurisdiction near us with a final map (published May 2026, reference period 2012-2021). We ran our pipeline on 8 November 2026 without opening Verra's files, wrote the numbers down, then requested Verra's open-access map and compared.
| Verra, final (TerraCarbon, May 2026) | Wovoka, blind, first night | Wovoka, after Cambodia's own forest definition and Verra's reading rule | |
|---|---|---|---|
| Forest at the start of the period | about 8.3 M ha (10% canopy, 5 m) | 3.5 M ha (moist-forest archive) to 6.0 M ha (classifier trained on plots from another country) | 7.2 M ha (classifier trained on Cambodia's own plots) |
| Sample | 1,094 plots, human-read | 1,410 plots, AI-read, one pass | 2,010 plots, AI-read, doubtful calls re-read under Verra's rule |
| Activity data (hectares cleared a year) | 190,347 ± 9.8% | 249,336 ± 24% (interval 189k to 309k) | 198,049 with confident flips (+4%); 161,573 with every doubtful call flipped (−15%) |
| Pattern agreement, 224 cells of 100,000 ha | rank correlation 0.83 | rank correlation 0.86; typical cell disagreement 216 ha/yr, a third of the median cell |
Top provinces
Stung Treng, Preah Vihear, Ratanak Kiri, Mondul Kiri, Pursat, Kampong Thom, Kratie
the same seven
the same seven
What matched on the first night. The risk went to the same provinces, and across 224 cells the two maps ranked the risk the same way at 0.83. Our first sample put the national number 31% above Verra's with a 24% interval that contained Verra's figure. For a one-night run with no Cambodia-specific tuning, that was the pattern result we hoped for.
What did not. Our forest map found half of Verra's forest. The moist-forest archive we started from does not see Cambodia's dry dipterocarp forest in the north and east, and a classifier trained on plots from a moist-forest country saw it only partly. And the national number ran high. Adding 600 plots the same night took the interval from 24% to 9.6%, under Verra's 10% line, but the level did not move: 238,660 hectares a year, 25% above Verra, and the two intervals no longer overlapped. Once sampling error is small, the gap that remains is interpretation.
What closed the gap: Verra's reading rule. Our first protocol marked any visible loss of tree cover in a 30 m box. Verra's provider judged half-hectare plots with a 10% canopy threshold: the land must have been forest in 2012 under that rule, and it is cleared only if it is below the rule at the end. We re-read our 203 "cleared" calls in the unmapped strata that way. One in three did not survive: a quarter still had trees at the end, and one in eight was not forest in 2012 under the 10% rule. Under Verra's rule our national figure becomes 198,000 hectares a year when only the confident flips are taken (4% above Verra) and 162,000 when every doubtful call is flipped (15% below). Verra's figure sits between the two. The entire gap was the reading protocol, and it is now the protocol for every country.
What closed the forest gap: Cambodia's own plots. Retrained on Cambodia's 2,010 plot reads, our forest classifier agrees with the reads 86% of the time in cross-validation (93% where the reader was sure), against 74% for the European Commission's tropical moist forest map. With that extent the forest area comes out at 7.2 million hectares against about 7.4 million with risk on Verra's map, the rank correlation of risk across 100,000-hectare cells rises from 0.83 to 0.86, and the typical disagreement between the two maps per cell falls from 248 to 216 hectares a year. The lesson is cheap and general: train the forest map on the country's own plots before the final run, which costs forty minutes and a two-kilobyte model.
Where the two maps still differ. We put more risk in the dry lowland forest of the north (Kampong Thom, Stung Treng, Kratie), where our plots found recent clearing that the moist-forest archive never saw, and less in the dry forest of Mondulkiri and the Cardamom foothills, where our classifier still calls some open dipterocarp forest non-forest and Verra's covariates spread risk into standing forest. The figure below shows both maps on one colour scale, with the six cells where they differ most circled and the plot reads behind each explained. That is the question the team's human second reads will settle; none have been done yet, and the figure says what the plots read so far.
What Cambodia taught us
- The forest definition is the result. Cambodia's map differed from ours by a factor of two before a single model ran, because "forest" meant moist closed canopy in our inputs and 10% canopy in Verra's. Every country now starts by adopting the jurisdiction's own definition and training the forest map on that country's own plots. Mai-Ndombe uses 30% and 3 m; Cambodia 10% and 5 m; the two maps are not comparable to each other, and neither is comparable to a map built on a global forest product.
- The reading rule is the rest. Marking every visible loss of tree cover put our number 25% high. Judging half a hectare under the 10% rule, forest at the start and below it at the end, put it within 4%. The rule is now written into the AI's instructions and the human reading page for every country.
- The sample is the number; the map is the pattern. The pixel count from any change product is wrong in a direction you cannot know in advance (half of the truth in Cambodia; several times too high in forests where fire, logging and storms change the canopy without clearing it). A stratified sample of a thousand or two plots, read against dated imagery, lands in the right place either way. The map's job is to put that number where the risk is, and there our map already ranks cells like Verra's.
- AI reads are a first pass, not a verdict. A language model reading a plot panel is fast and consistent, and right most of the time; but it is unsure about a third of the time in dry and open forest, and its errors are correlated, so they do not average out. Two human reads on the plots the model marked unsure, and on every plot where the map and the model disagree, are what turn an estimate into a number a buyer can rely on. For Cambodia those reads are next.
- Open forest is where the work is. Dry dipterocarp in Cambodia, miombo woodland in East Africa, secondary growth after typhoons in the western Pacific: the hard calls are all in forest with 10 to 40% canopy, which is also where most unplanned clearing happens. Sampling effort goes there.
- Write it all down. Every run has a decision log, a method note, the plot panels and reads on a page anyone with staff access can open, and a version number on the published layer. A number that cannot be traced to its plots is a number nobody should price a forest on.
What comes next
Human second reads in Cambodia. The 2,010 plots go to our foresters on the Check a plot page, two readers per plot, blind to the AI's call. Where they disagree with it, the label changes, the estimator reruns and the layer is rebuilt under a new version. We will publish the result beside the figures above.
The same test in other countries. Verra has now published maps for eight jurisdictions. We are running the same blind-then-compare test in the ones in our regions, each under its own forest definition, and will report each one here as it completes, including where we are wrong and why. A calibration that only reports its successes is not a calibration.
Then the countries with no map. Indonesia, Malaysia, Vietnam, Laos, Myanmar, Kenya, Uganda, in the order the demand comes. Once the forest step is parameterised by definition and the classifier has been trained on reads from several countries, a new country is a configuration file and an overnight run: hours of compute, a day of AI reads, and a published layer with its interval. The human reads follow and tighten it.
What done looks like. A country page that shows our layer, its version, its interval, the number of human reads behind it, and, where Verra has published, the comparison. When Verra's final map arrives, our layer is retired for that country and the comparison stays up as the record.
Why we give it away
Wovoka is a natural capital operator. We work with communities to increase what their land yields: through global markets for what they grow under trees (Buji Vanilla in Uganda, Mindoro Coffee in the Philippines) and through payment for the ecosystem services the same land provides, starting with carbon. The “io” in wovoka.io is input to output: what a capital provider puts in should reach the land steward as trees in the ground, with as little as possible lost to the layers in between. Paying consultants for two years to learn what land can yield is one of those layers, so we bring open data and open methods to life for the market. Verra’s map stays the standard; we shorten the wait. We do not sell maps. We take a landscape from unknown to investable, and a free early baseline for any country serves that in three ways.
- It moves the market's first question forward by two years. Landowners, communities, developers and buyers can screen a site against a Verra-method number on day one, with its uncertainty, instead of waiting for the jurisdiction's map. More sites get looked at; the good ones move sooner.
- It is the honest way to earn trust in our own numbers. Every claim we make for our own projects rests on the same pipeline. Publishing it, calibrating it in the open against Verra's maps, and showing where it was wrong is the only form of credibility that survives contact with a diligence team.
- It brings us the people and the data we need. Every country someone runs, every plot a forester reads, improves the classifier and the sample design for the next country.
Who it is for. Project developers screening a region. Investors, lenders and buyers checking a developer's baseline claim. Governments and NGOs who want a first view of their jurisdiction before Verra's provider arrives. Researchers who want a reproducible, documented run of VMD0055 on open data.
What it is not. It is not Verra's map and cannot be used in a Verra project document. It is not a credit forecast: the hectares a year it allocates become emissions only with a project's own carbon stocks, and become credits only after leakage, buffer and uncertainty deductions that are the project's to make. It is not a substitute for ground work: the step from a number on a map to a project is tenure, consent and a community, which is what Wovoka does.
How we talk about it. Plainly. Our estimate, Verra's method, open data, a published comparison, an interval on every number. No claims of accuracy we have not measured against a published map.
Wovoka’s estimate, built on Verra’s published method (VM0048, VMD0055, VT0007) and open data. It is not Verra’s map. Verra’s open-access jurisdictional maps are released as is for due diligence and are cited here as Verra’s published maps. Questions about the method or a country: hello@wovokagroup.com.